Data collection and surveys
Matt Bhagat-Conway
Survey administration methods
- Online
- Easy, minimal data entry, survey logic minimizes respondent burden
- Excludes people who don’t have internet access, are not tech savvy, or do not trust technology
- Paper
- Can be scantron type, or manual data entry
- Expensive: printing, data entry
- Telephone
- Not used much anymore
Recruitment methods: intercept surveys
- Approach people where they are
- Often used for transit—approach people at stations or on vehicles
Recruitment methods: mailing
- Mail survey materials to selected addresses
- Often from mailing list purchased from marketing companies
- Printing is expensive, turnaround times are slow
- Many newer mail surveys just send a link to a site where the survey can be filled out online
Recruitment methods: email
- Invite respondents via email
- Often with purchased email lists
- Can work well with a list of people you already have
- Very difficult to avoid going to spam
- Low response rates (COVID Future Survey: 0.4% Chauhan et al. (2021))
Recruitment methods: social media
- Social media ads can be effective
- Not very expensive
- Representativeness is a challenge
- Social media ad algorithms can directly undermine representativeness by advertising your survey to people similar to those who have already taken it
Recruitment methods: text message
- I haven’t seen much literature on this, but the Census Bureau is doing it
Sampling methods
- Your survey will almost always reach a sample of the population
- How the sample is designed is important when it comes time to analyze the data
The sampling frame
- Your sampling frame is the population from which you are drawing your sample
- e.g. all households in the US, all students at UNC, etc.
- Your sampling frame is generally not perfect - e.g. a list of residential address is likely incomplete and will miss unhoused people
Random sampling
- You randomly select from your sampling frame
- Almost always without replacement—the same unit cannot be sampled twice
Stratified sampling
- You randomly select from your sampling frame, but some units are more likely to be selected than others
Cluster sampling
- You sample a cluster of individuals (e.g. in a neighborhood or at a bus stop)
Convenience sampling
- You sample convenient respondents
- Many planning studies use convenience samples, though they strive for representativeness
Snowball sampling
- You ask earlier participants to invite other participants they may know
- Can create problems for statistics if the people share some unobserved characteristics
Survey panels
- A newer approach is to use a “survey panel”—a group of respondents curated by a company
- The company will charge per completed response
- Useful especially for national samples of common groups, less useful for specific groups
Quota sampling
- To help ensure a representative sample, set maximum quotas for groups
- You can’t specifically set a minimum quota, but you can set a maximum for anyone not in that group
- Often combined with other sampling techniques
Household, person, etc. level surveys
- Most surveys are at the person level
- Other surveys are at the household level - all members of a household are surveyed
- Typical of travel surveys - significant inter-household dynamics
Panel/longitudinal studies
- Panel or longitudinal studies sample the same people over time
- Very useful, especially to understand cause
- But rare - expensive, not aligned with funding cycles
- Significant attrition is common
- In the COVID Future survey, we lost about 2/3 of respondents from Wave 1 to 2
Sampling and statistics
- Anything other than a simple random sample theoretically requires adjusting standard errors (and possibly means)
- We’ll talk a little about this when we talk about weighting
Does any of this matter?
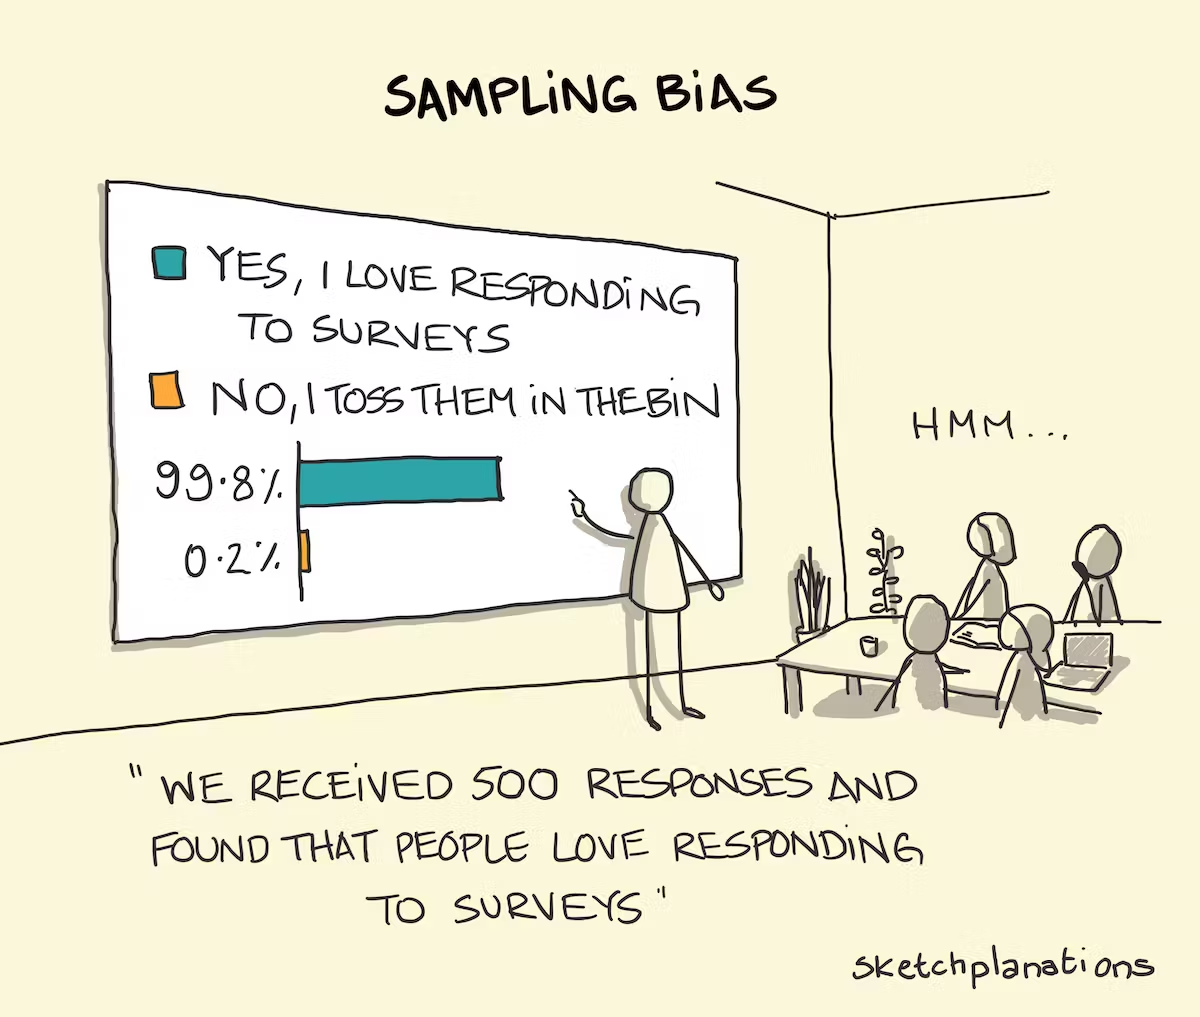
- this is actually nonresponse bias, not sampling bias
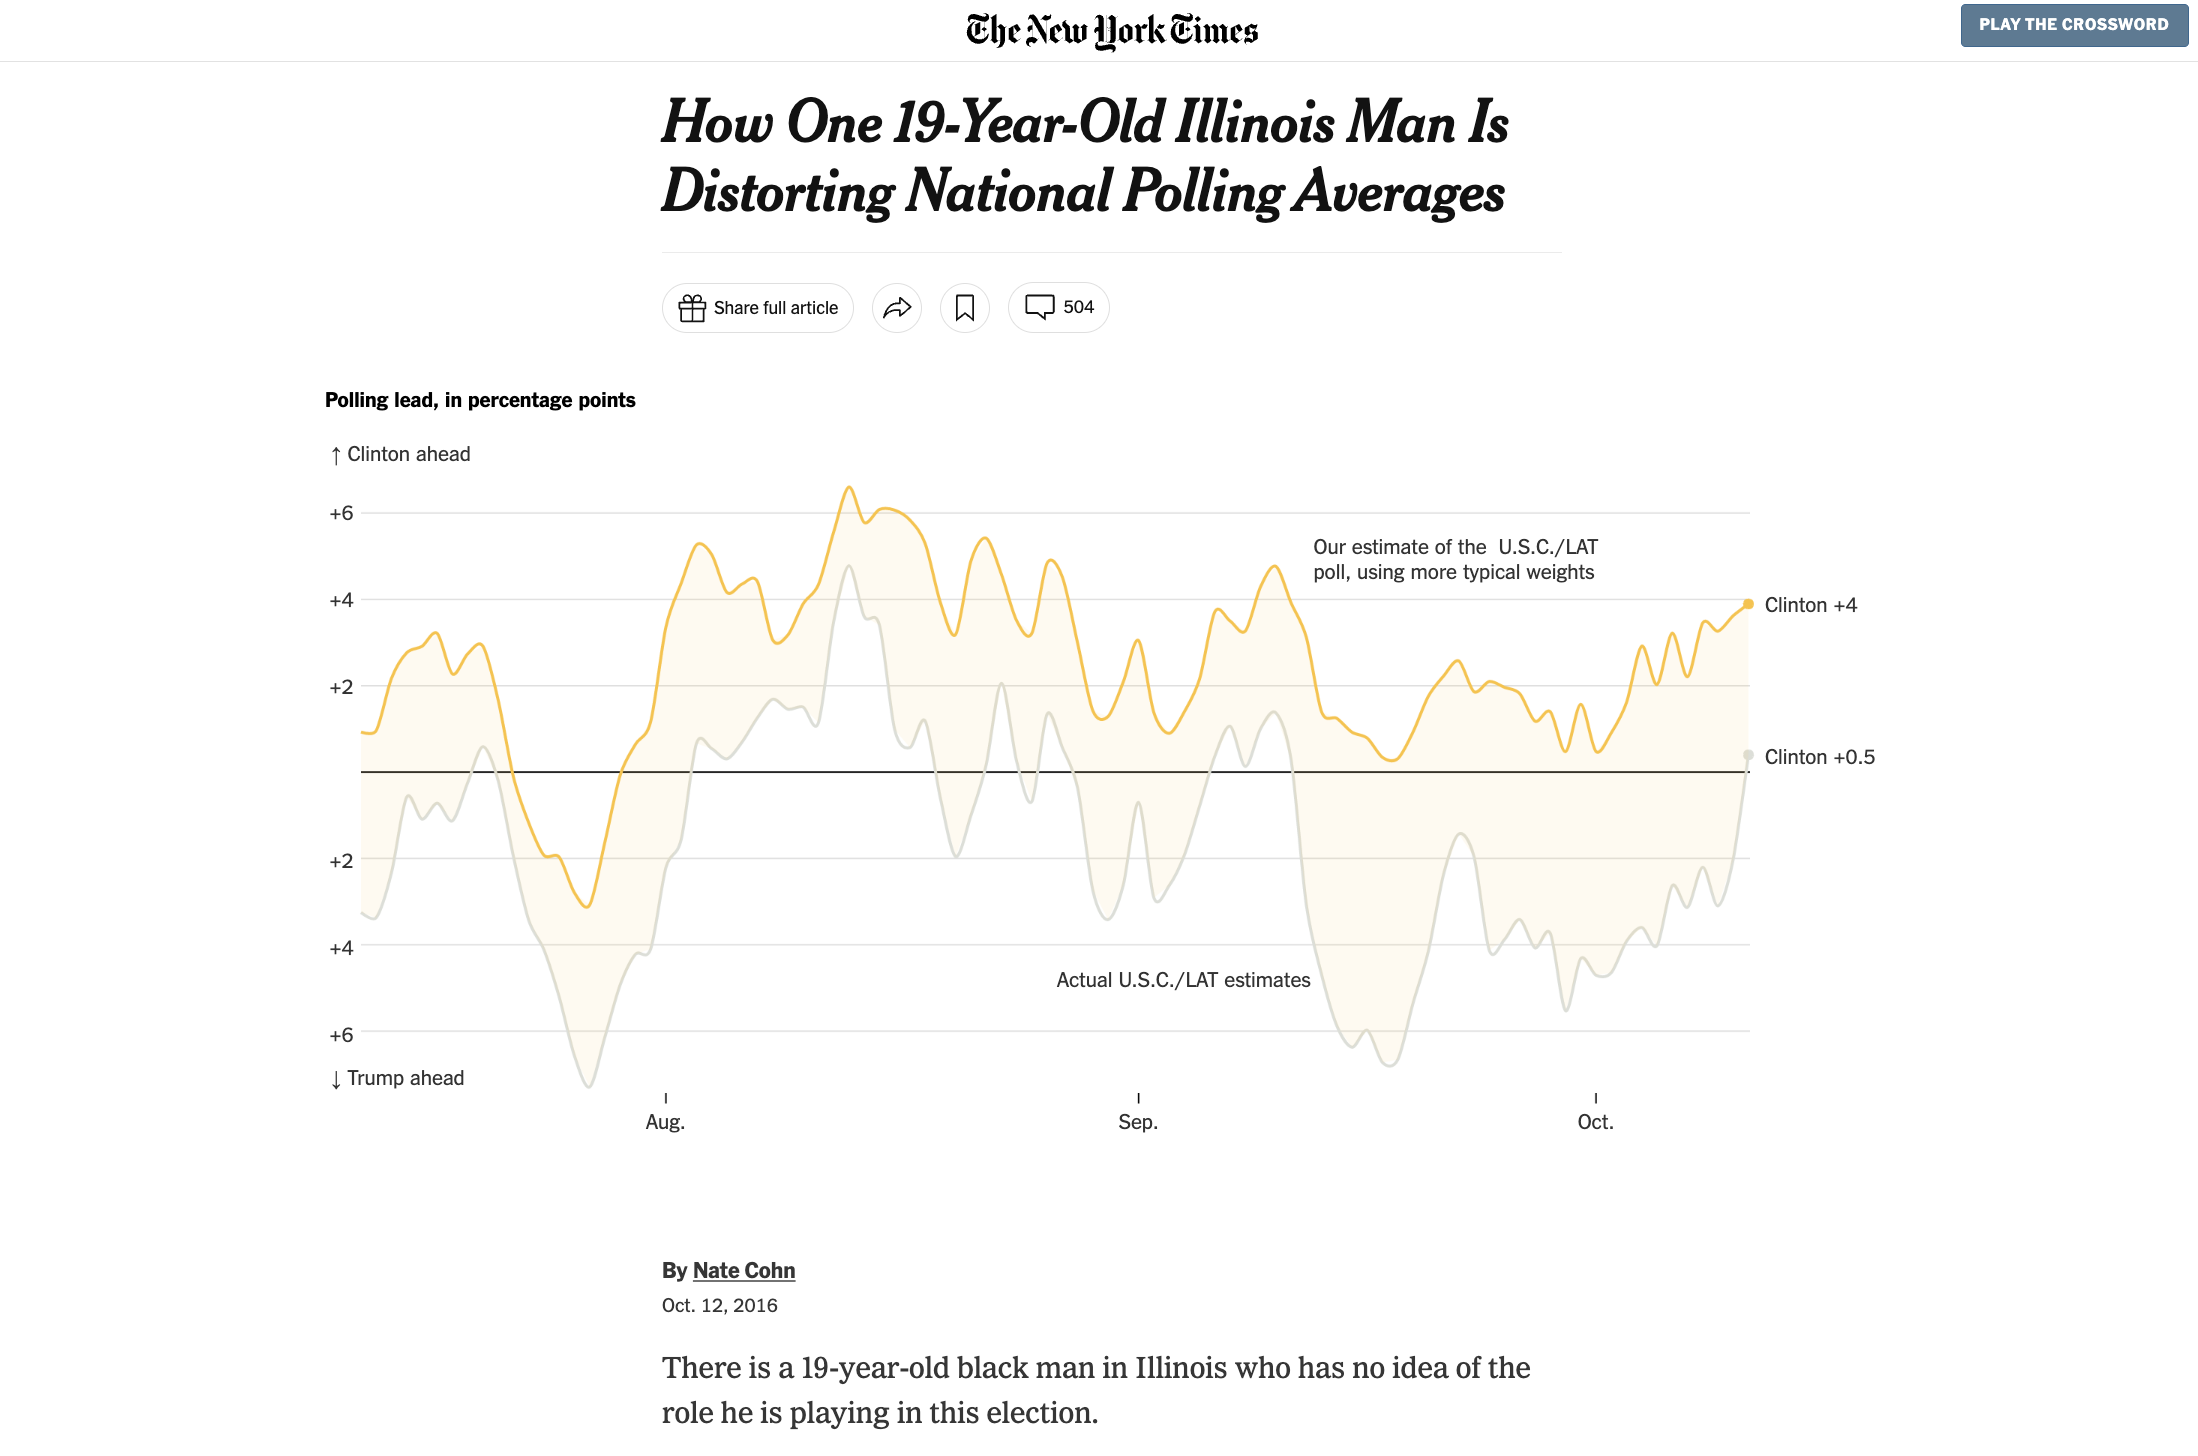
Does any of this matter?
- High rates of non-response undermine even the best sampling designs
- We still need to correct for non-response
- But a good sampling design gives your survey the best chance
Nonresponse
- What do you think typical survey response rates are?
- 2021 Triangle Travel Survey: 3.7%
- 2024 UNC nighttime travel survey: 4.7%
- 2022 NHTS: 11%
- 2020–2021 COVID Future survey: 0.4% in email sample (Chauhan et al. 2021)
Weighting your survey
- Most large surveys are weighted
- A weight is a number assigned to each response, representing how influential it should be
Weighting your survey
- The ideal weight is the inverse sampling probability
- if someone has a probability of 0.01 of being sampled and responding, their weight would be 100.
- if someone else has a probability of 0.02, their weight would be 50
- The idea is that there first person was half as likely to respond, therefore there are twice as many people like them in the population
The weighted mean
\[ \bar x = \frac{\sum\limits_{i=1}^{n} w_i x_i}{\sum\limits_{i=1}^{n}w_i} \]
- A normal mean is a weighted mean where all the weights are 1
The weighted standard error
- Non-random samples can inflate or deflate standard errors/standard deviations
- Generally speaking,
- Clustering inflates standard errors
- Stratification decreases them
- Corrections to the standard error/standard deviation formula are complex and survey-specific
- Look at the documentation of the survey you’re using
Weights in regression
- It’s often not necessary to use weights in regression
- You just need to control for the variables used to make the weights
- The regression measures the relationships of interest holding other things constant - e.g. the relationship between free transit passes and transit use, holding income constant
- Basically, if (we assume) everyone has the same response to free transit passes, we are okay
- They probably don’t, and we would use an interaction term for this
- Where this gets tricky is if you have heterogeneity in coefficient values for different groups
See further: Solon et al. (2015)
Dangers in weighting
Creating weights
- Are we likely to know the sampling probability?
- We may have some information on it from a stratified sampling design
- But we won’t know anything about how nonresponse has affected sampling probability
Creating weights
- Any survey you conduct is more than likely nonrepresentative
- We use Census data to determine population proportions in different groups, and then adjust the proportions in our sample to match
Creating weights
- If all the population proportions we want are in a single Census/ACS table, weighting is easy
- The weight for each individual is the ratio of their population and sample proportions
- So if 15% of the sample is Hispanic, and 30% of the population in the are surveyed is, we give all Hispanics a weight of 2
Creating weights
- Often, you want to create weights from a set of variables that does not have a specific Census crosstab
- For this, you can use iterative proportional fitting
Iterative proportional fitting
- We start by cross-classifying the survey variable by all of the dimensions we’re interested in, expressed as proportions of the total sample
- Sometimes people do this with numbers rather than proportions - the result is similar
- This is the seed matrix
- Then, you get the total proportions for each row and column from the Census
- Again, sometimes population totals
- These are the marginals
Iterative proportional fitting
- Adjust each row so that the total in the row equals the marginal value for that row (by multiplying by the marginal value divided by the sum of the row)
- Do the same with the columns
- Repeat until the results are stable
- IPF uses the control totals, but also accounts for correlations using the sample itself
Note: I want you to know what this is, and have a basic understanding of how it works - I don’t need to know how to do it from memory
Respondent compensation
- In many research surveys (especially long ones!) compensation is offered
- This might be money, but is often a gift card
- Sometimes it’s a lottery
- UNC generally doesn’t like this
- Some states consider this gambling
Survey instrument design
- The survey instrument is the actual survey the respondents experience
- Good design of survey instruments increases data reliability and response rate
Survey response burden
- Burden of the survey is how long it takes to complete
- And how difficult/intrusive aspects of it are
- One of the biggest challenges in survey design is balancing burden and information collected
Use survey logic
- Many surveys are constructed electronically nowadays
- Every online survey platform lets you skip questions based on previous questions
- This lowers respondent burden and prevents confusion
Response types: multiple choice
- Can be a single question or a matrix
- Can allow single or multiple responses
- Implications for how data is recorded
Response types: open-ended
- Free text entry (possibly length-limited, constrained to numbers, etc.)
- Harder to analyze, but often yields richer results
Response types: Likert scale
- Very common for attitudes and perceptions
- Strongly disagree, disagree, neutral, agree, strongly agree
- Or some variation—somewhat agree, etc.
- Sometimes neutral option is left out
- Generally, the “question” is actually a statement
- e.g. “I think we should do more to save the environment”
- Also used for behaviors
- I recycle whenever I can
Writing good survey questions
- Advice largely from Stopher (2012)
Threatening questions
- Some questions may be perceived as “threatening”
- e.g. income, illegal behaviors
- Explaining why you are asking the question may help
- Open ended responses may help
- Asking later in the survey may help
Age
- Often, people are more comfortable sharing the year they were born than their age :thinking_face:
Location
- Often, people are uncomfortable sharing their home address, and it’s often not necessary
- Alternatives
- ZIP codes (same problems as Census ZCTAs)
- Cross streets (difficult to geocode, may need manual coding)
Other people
- Questions about others are often seen as threatening (am I allowed to share this?)
Clear and concise questions
- Questions should be clear and concise
- They should not use complex words
- It’s better to use multiple sentences than one long one
- Tools like Hemingway App are useful to reduce the grade level of your writing
Double-barreled questions
- A double-barreled question is two topics covered by a single question
- Do you think public transport is too expensive and slow in your region?
- Do you like piña coladas and getting caught in the rain?
- Can be subtle; from the Census Pulse survey: “In the area where you live and shop, how concerned are you, if at all, that prices will increase in the next six months”
Tradeoffs and false dichotomy
- When you ask questions about tradeoffs, make sure you don’t present false dichotomies
- Do you drive to campus or bike?
Include “other, specify” options
- When you have a multiple choice question where they may be other responses, it’s a good idea to include “other, specify” options
- This can capture response options you might have missed
Think about who will be left out by questions
- I once took a survey that started by asking how I got to work, then followed up with a bunch of questions about my satisfaction with parking
- In cases like these, you should use survey logic to skip questions that don’t apply
Priming
- Priming is when earlier questions (or answers) affect later responses
- Especially an issue with attitudinal surveys—people make their reported attitudes and behaviors consistent, even when they are not
Usual/normal activities
- These can be subjective
- A lot of interesting planning questions are driven by the non-normal activities
- e.g. vehicle trips over 100 miles are ~1% of all trips, but 21% of overall vehicle miles traveled (2017 NHTS)
- The tail wags the dog
Recall
- Many surveys are retrospective
- People are not always good at remembering what they did in the past, how often they did it, or when they did it
- Most people are confident they remember where they were/what they were doing when they heard of the 9/11 attacks, but many of them are misremembering (Hirst et al. 2015)
Straightlining
- Sometimes, when respondents are tired or uninterested, they may “straight-line” responses
- Especially for matrix response questions
- Where they select the same answer for every question
- It’s useful to have some similar questions worded in opposite directions, to help differentiate straightliners from true responses
- e.g. “we should do more to protect the environment” and “air pollution is a relatively minor issue”
- Sometimes, people include “trap questions” - e.g. “Please select ‘strongly disagree’ for this question”
Other question ordering philosophies
- Ask screening questions early
- Some say demographics at end, when you have established more trust
- These questions are also easy to answer
- Opinions (if asked) can be helpful early on
Ask for permission to follow up
- It is really hard to recruit participants to a survey!
- It’s a good idea to ask respondents if you can re-contact them for a follow-up or additional surveys
- People who agree will have much higher response rates in the future
Add a “anything else you want to tell us” question
- Most people will skip it
- But for some people it gives them a chance to express something they feel was absent
- Or report issues with the survey
Survey pre-testing
- Pre-testing is an important part of survey deployment
- Test the survey yourself and among co-workers
- Try many different combinations of responses (especially if you have survey logic)
Pre-test on cell phones!
- An astonishing number of people take surveys on cell phones nowadays
Survey platforms
- Google Forms (very common, free)
- Qualtrics (powerful, ubiquitous in academia, approved by UNC for identifiable information)
Creating a survey in Google Forms
- Browse to forms.google.com
- Choose “+Blank”
Question types in Google Forms
- Multiple choice or checkboxes (one selection/multiple selections)
- Matrix
- Short/long answer
- Dropdown (use sparingly, e.g. for state)
Question validation
- You can add response validation to a text field, to only allow numbers, email addresses, or a regular expression (advanced text matching tool)
Survey logic in Google Forms
- Logic is pretty limited in Google Forms
- You can split your form into sections
- With multiple-choice questions, you can select “go to section based on answer” to skip to another section
Creating a survey in Qualtrics
- Log in to Qualtrics (unc.qualtrics.com)
- May need to request an account first
- Click “Create a new project”
- Choose “From Scratch > Survey”
Question types in Qualtrics
- Text/graphic (survey instruction blocks)
- Multiple choice (can be single or multiple response)
- Matrix table
- Text entry (can be short or long)
- More powerful validation than in Google Forms
Survey logic in Qualtrics
- There are three types of survey logic in Qualtrics
- Display logic
- Skip logic
- Survey flow
Display logic
- Display logic is conditions applied to a single question (or even a single response to a multiple choice question) that controls whether it is displayed
- Conditions can be complex, refer to multiple previous questions, etc.
Skip logic
- Skip logic is applied after the question it is associated with
- If the conditions specified are true, the survey will skip to a specified question
Survey flow/branch logic
- Like Google Forms, Qualtrics surveys can be divided into sections or “blocks”
- The “Survey Flow” editor lets you edit the ordering of these, and use “branching” to set conditions for when blocks will be displayed
Chauhan, Rishabh Singh, Matthew Wigginton Bhagat-Conway, Denise Capasso da Silva, et al. 2021. “A Database of Travel-Related Behaviors and Attitudes Before, During, and After COVID-19 in the United States.” Scientific Data 8 (1, 1): 245. https://doi.org/10.1038/s41597-021-01020-8.
Hirst, William, Elizabeth A. Phelps, Robert Meksin, et al. 2015. “A Ten-Year Follow-up of a Study of Memory for the Attack of September 11, 2001: Flashbulb Memories and Memories for Flashbulb Events.” Journal of Experimental Psychology: General 144 (3): 604–23. https://doi.org/10.1037/xge0000055.
Solon, Gary, Steven J Haider, and Jeffrey M Wooldridge. 2015. “What Are We Weighting For?” Journal of Human Resources 50 (2): 301–16. https://doi.org/10.3368/jhr.50.2.301.
Stopher, Peter. 2012. Collecting, Managing, and Assessing Data Using Sample Surveys. 1st ed. Cambridge University Press. https://doi.org/10.1017/CBO9780511977893.
![]()
Social desirability bias