| Estimate | Margin of Error | |
|---|---|---|
| Total: | 131,332,360 | 130,190 |
| ___Owner occupied: | 85,685,869 | 259,497 |
| ______No vehicle available | 2,851,977 | 30,634 |
| ______1 vehicle available | 22,411,594 | 102,488 |
| ______2 vehicles available | 36,008,834 | 149,008 |
| ______3 vehicles available | 15,943,552 | 73,891 |
| ______4 vehicles available | 5,765,611 | 42,785 |
| ______5 or more vehicles available | 2,704,301 | 25,293 |
| ___Renter occupied: | 45,646,491 | 154,839 |
| ______No vehicle available | 8,228,177 | 54,940 |
| ______1 vehicle available | 21,356,253 | 88,845 |
| ______2 vehicles available | 11,910,763 | 75,873 |
| ______3 vehicles available | 2,971,923 | 37,311 |
| ______4 vehicles available | 841,014 | 17,316 |
| ______5 or more vehicles available | 338,361 | 11,062 |
Working with Census data
Matt Bhagat-Conway
Census data
- The US Census Bureau is the primary data-collection arm of the federal government
- Census data is one of the most common datasets used in planning
Group project 1: Census data analysis
- Identify a research question you’re interested in that has potential policy implications
- Work with a group of 3–5 to attempt to answer the question using Census data
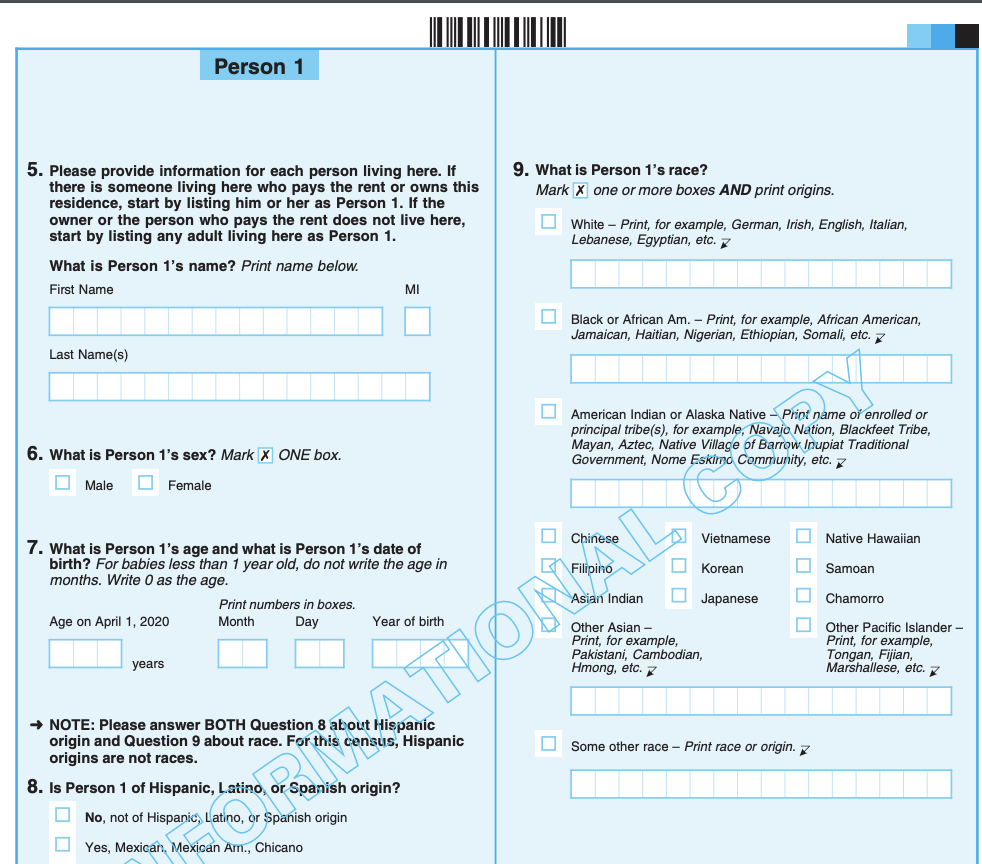
The Decennial Census
- By constitutional mandate, the Census Bureau conducts a full census of every person in the US every 10 years (since 1790)
- Primary purpose is to apportion US House seats
- Very limited information
The American Community Survey
- Up until the 2000 Census, there was a “long-form” questionnaire that a fraction of households received, covering a lot more topics
- Starting in 2005, the Census Bureau launched the American Community Survey
- This samples only a fraction of the population, but covers a much wider variety of topics
- Survey is conducted annually
Census geography
- The Census is primarily enumerated by states, counties, and a set of hierarchical divisions of counties
- There are a number of other enumeration geographies outside of the standard hierarchy
The problem with counties
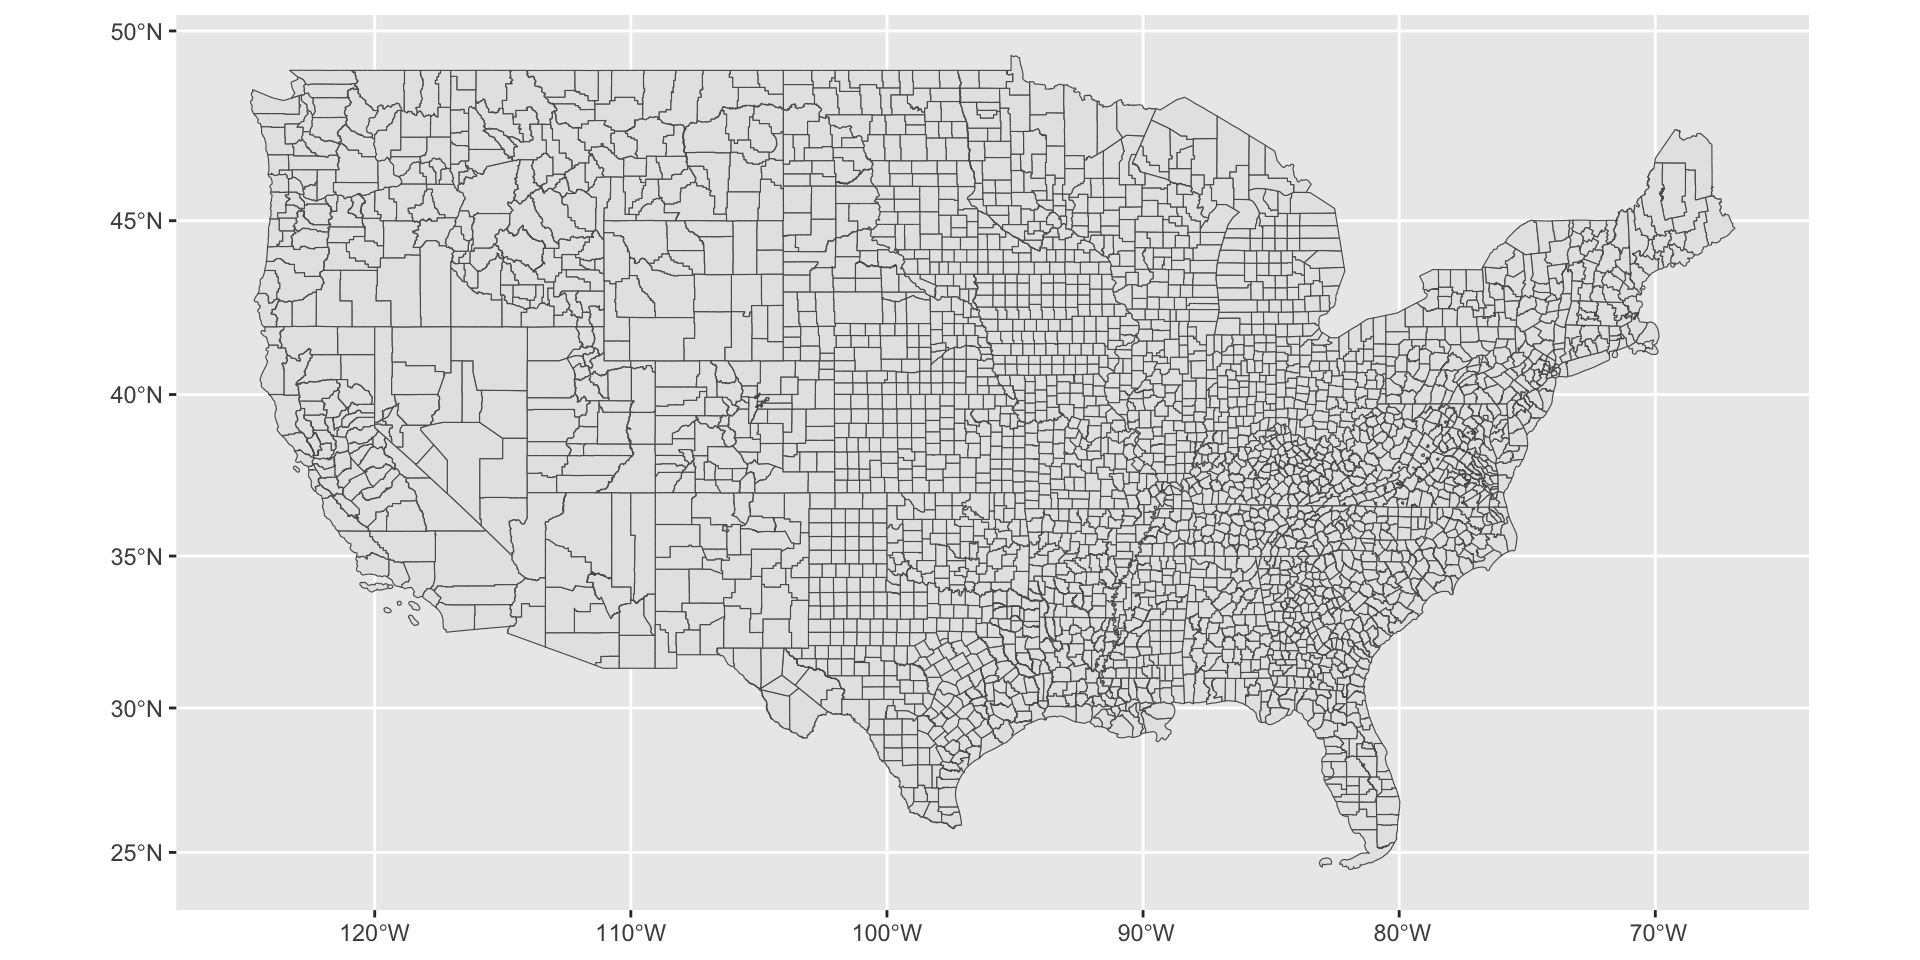
Subdivisions of counties
- Normal census hierarchy
- Census tracts
- Census block groups
- Census blocks
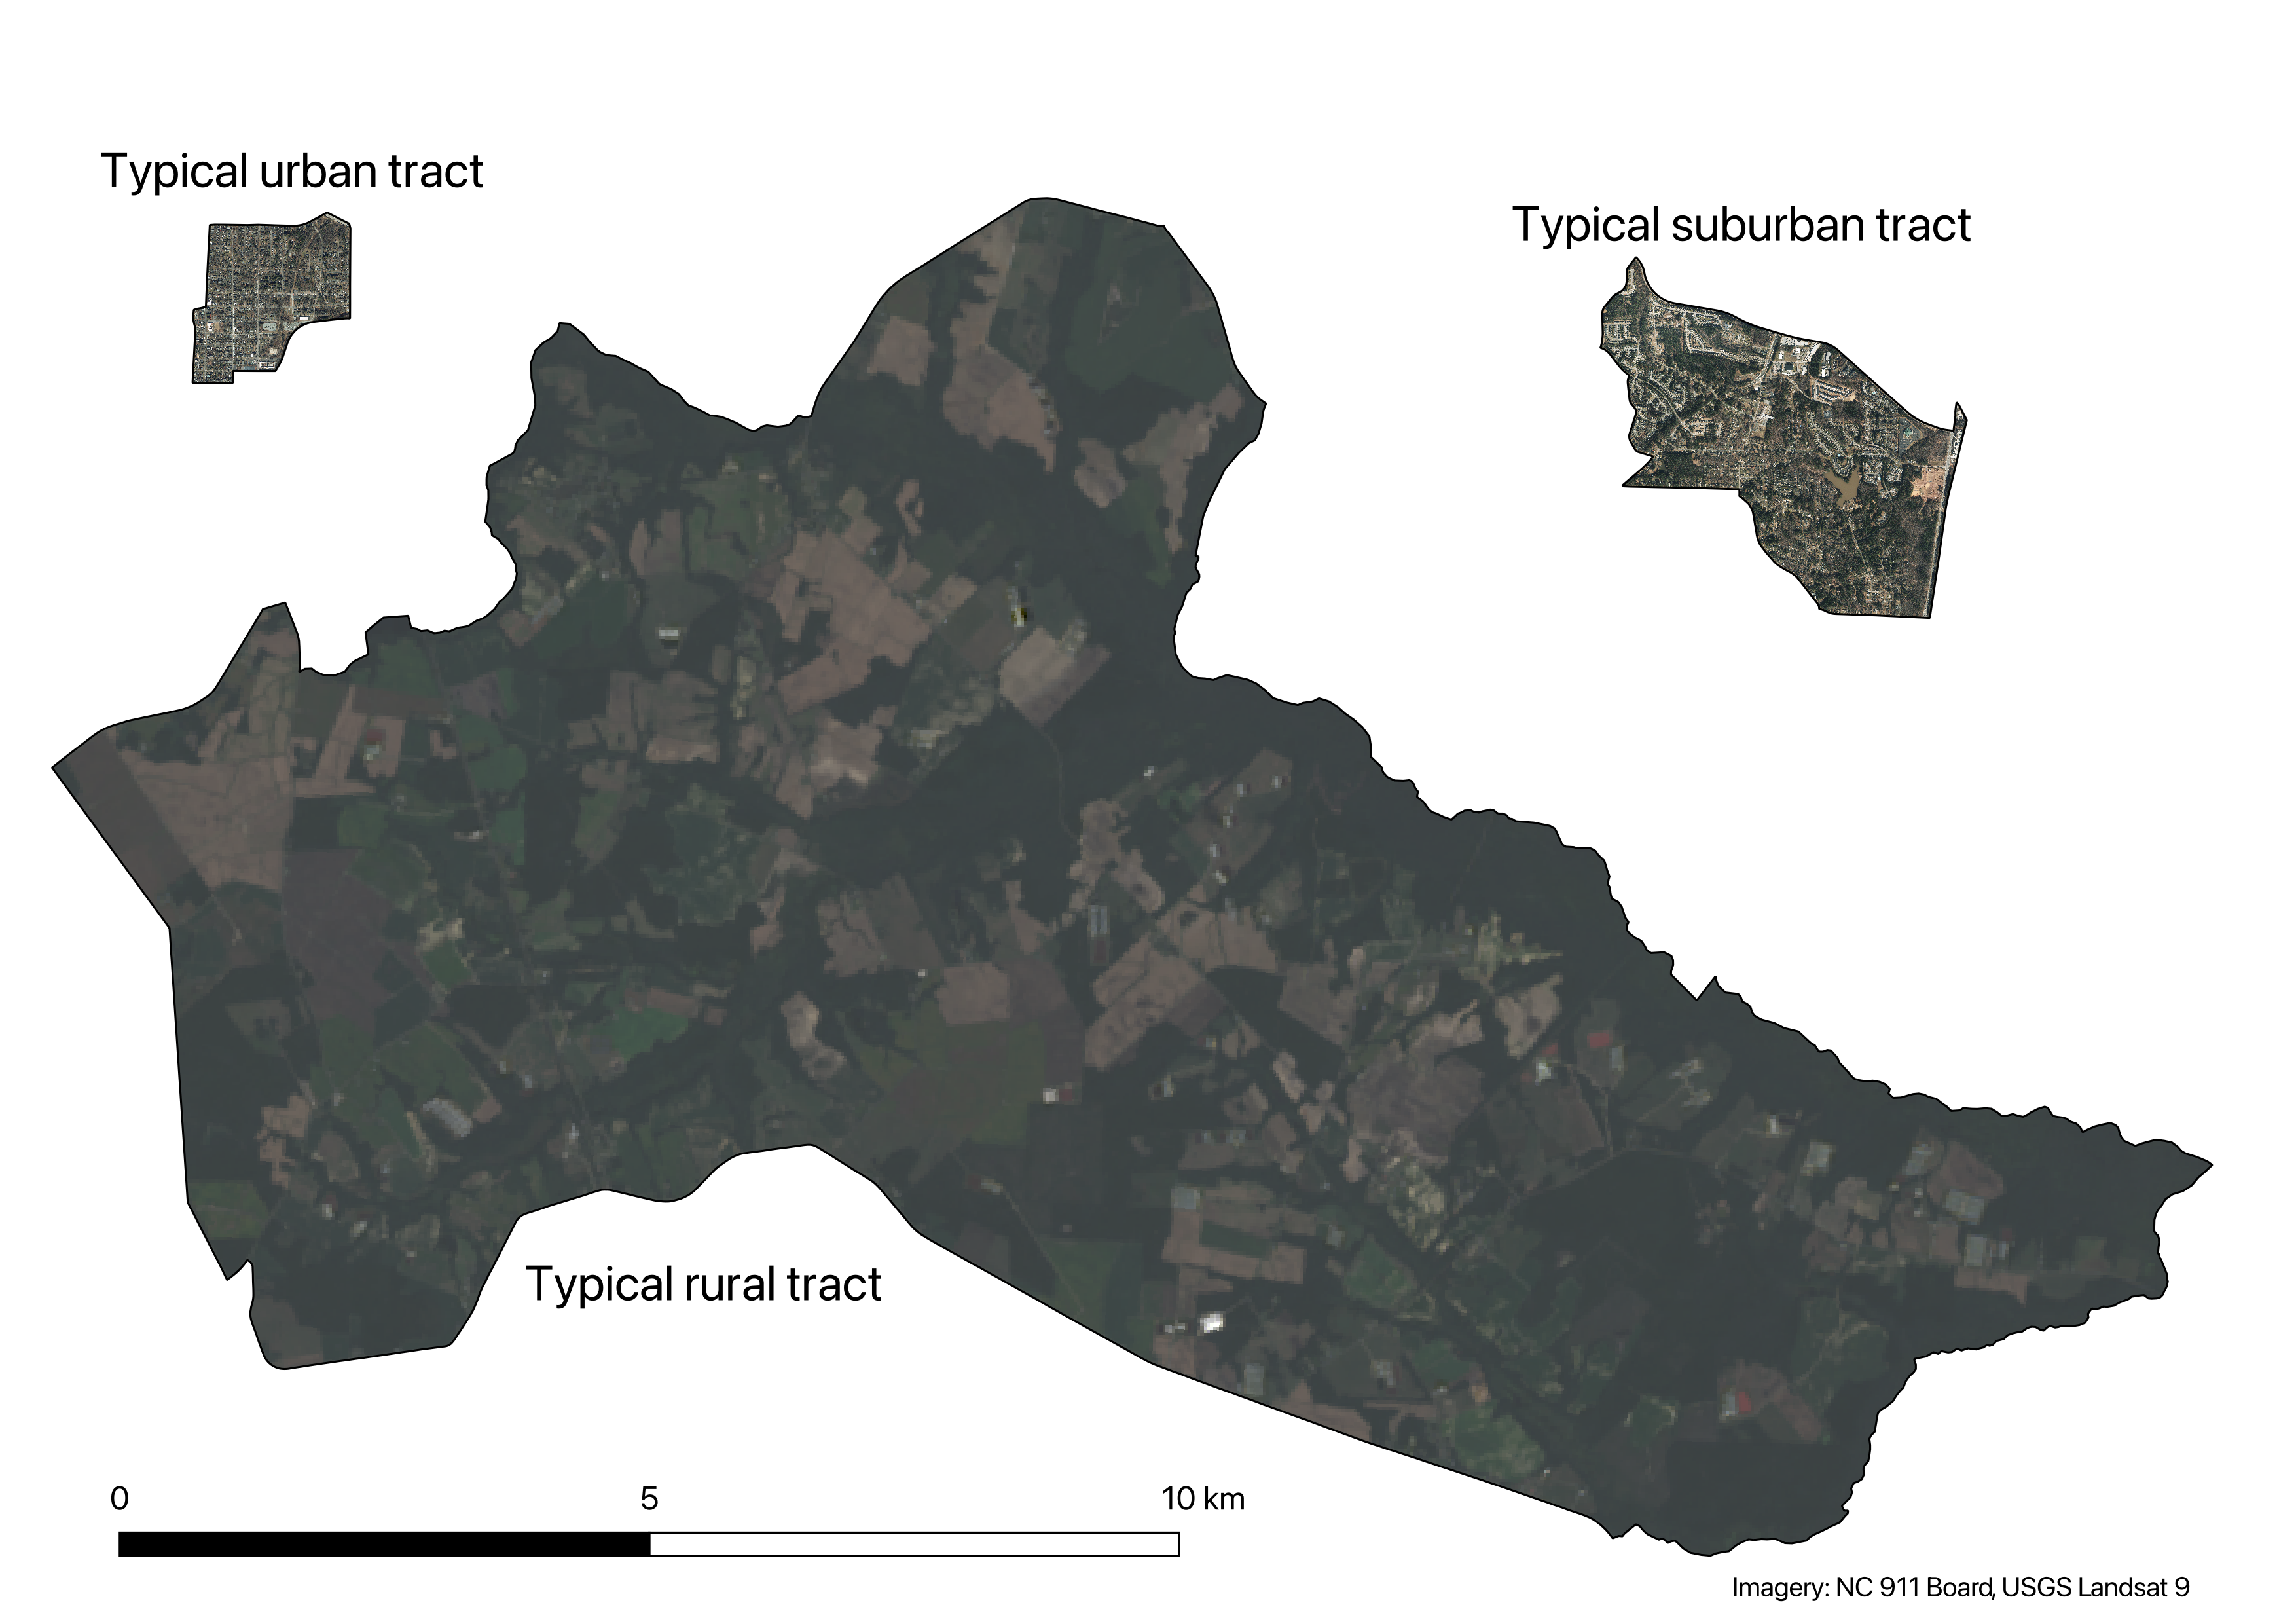
Census tracts
- Divisions of counties
- Generally 1,200–8,000 people
- Redrawn every 10 years, but generally remain similar across time
- Most Census data products as well as many other agencies’ data is available at the Census tract level
Census tracts, to scale
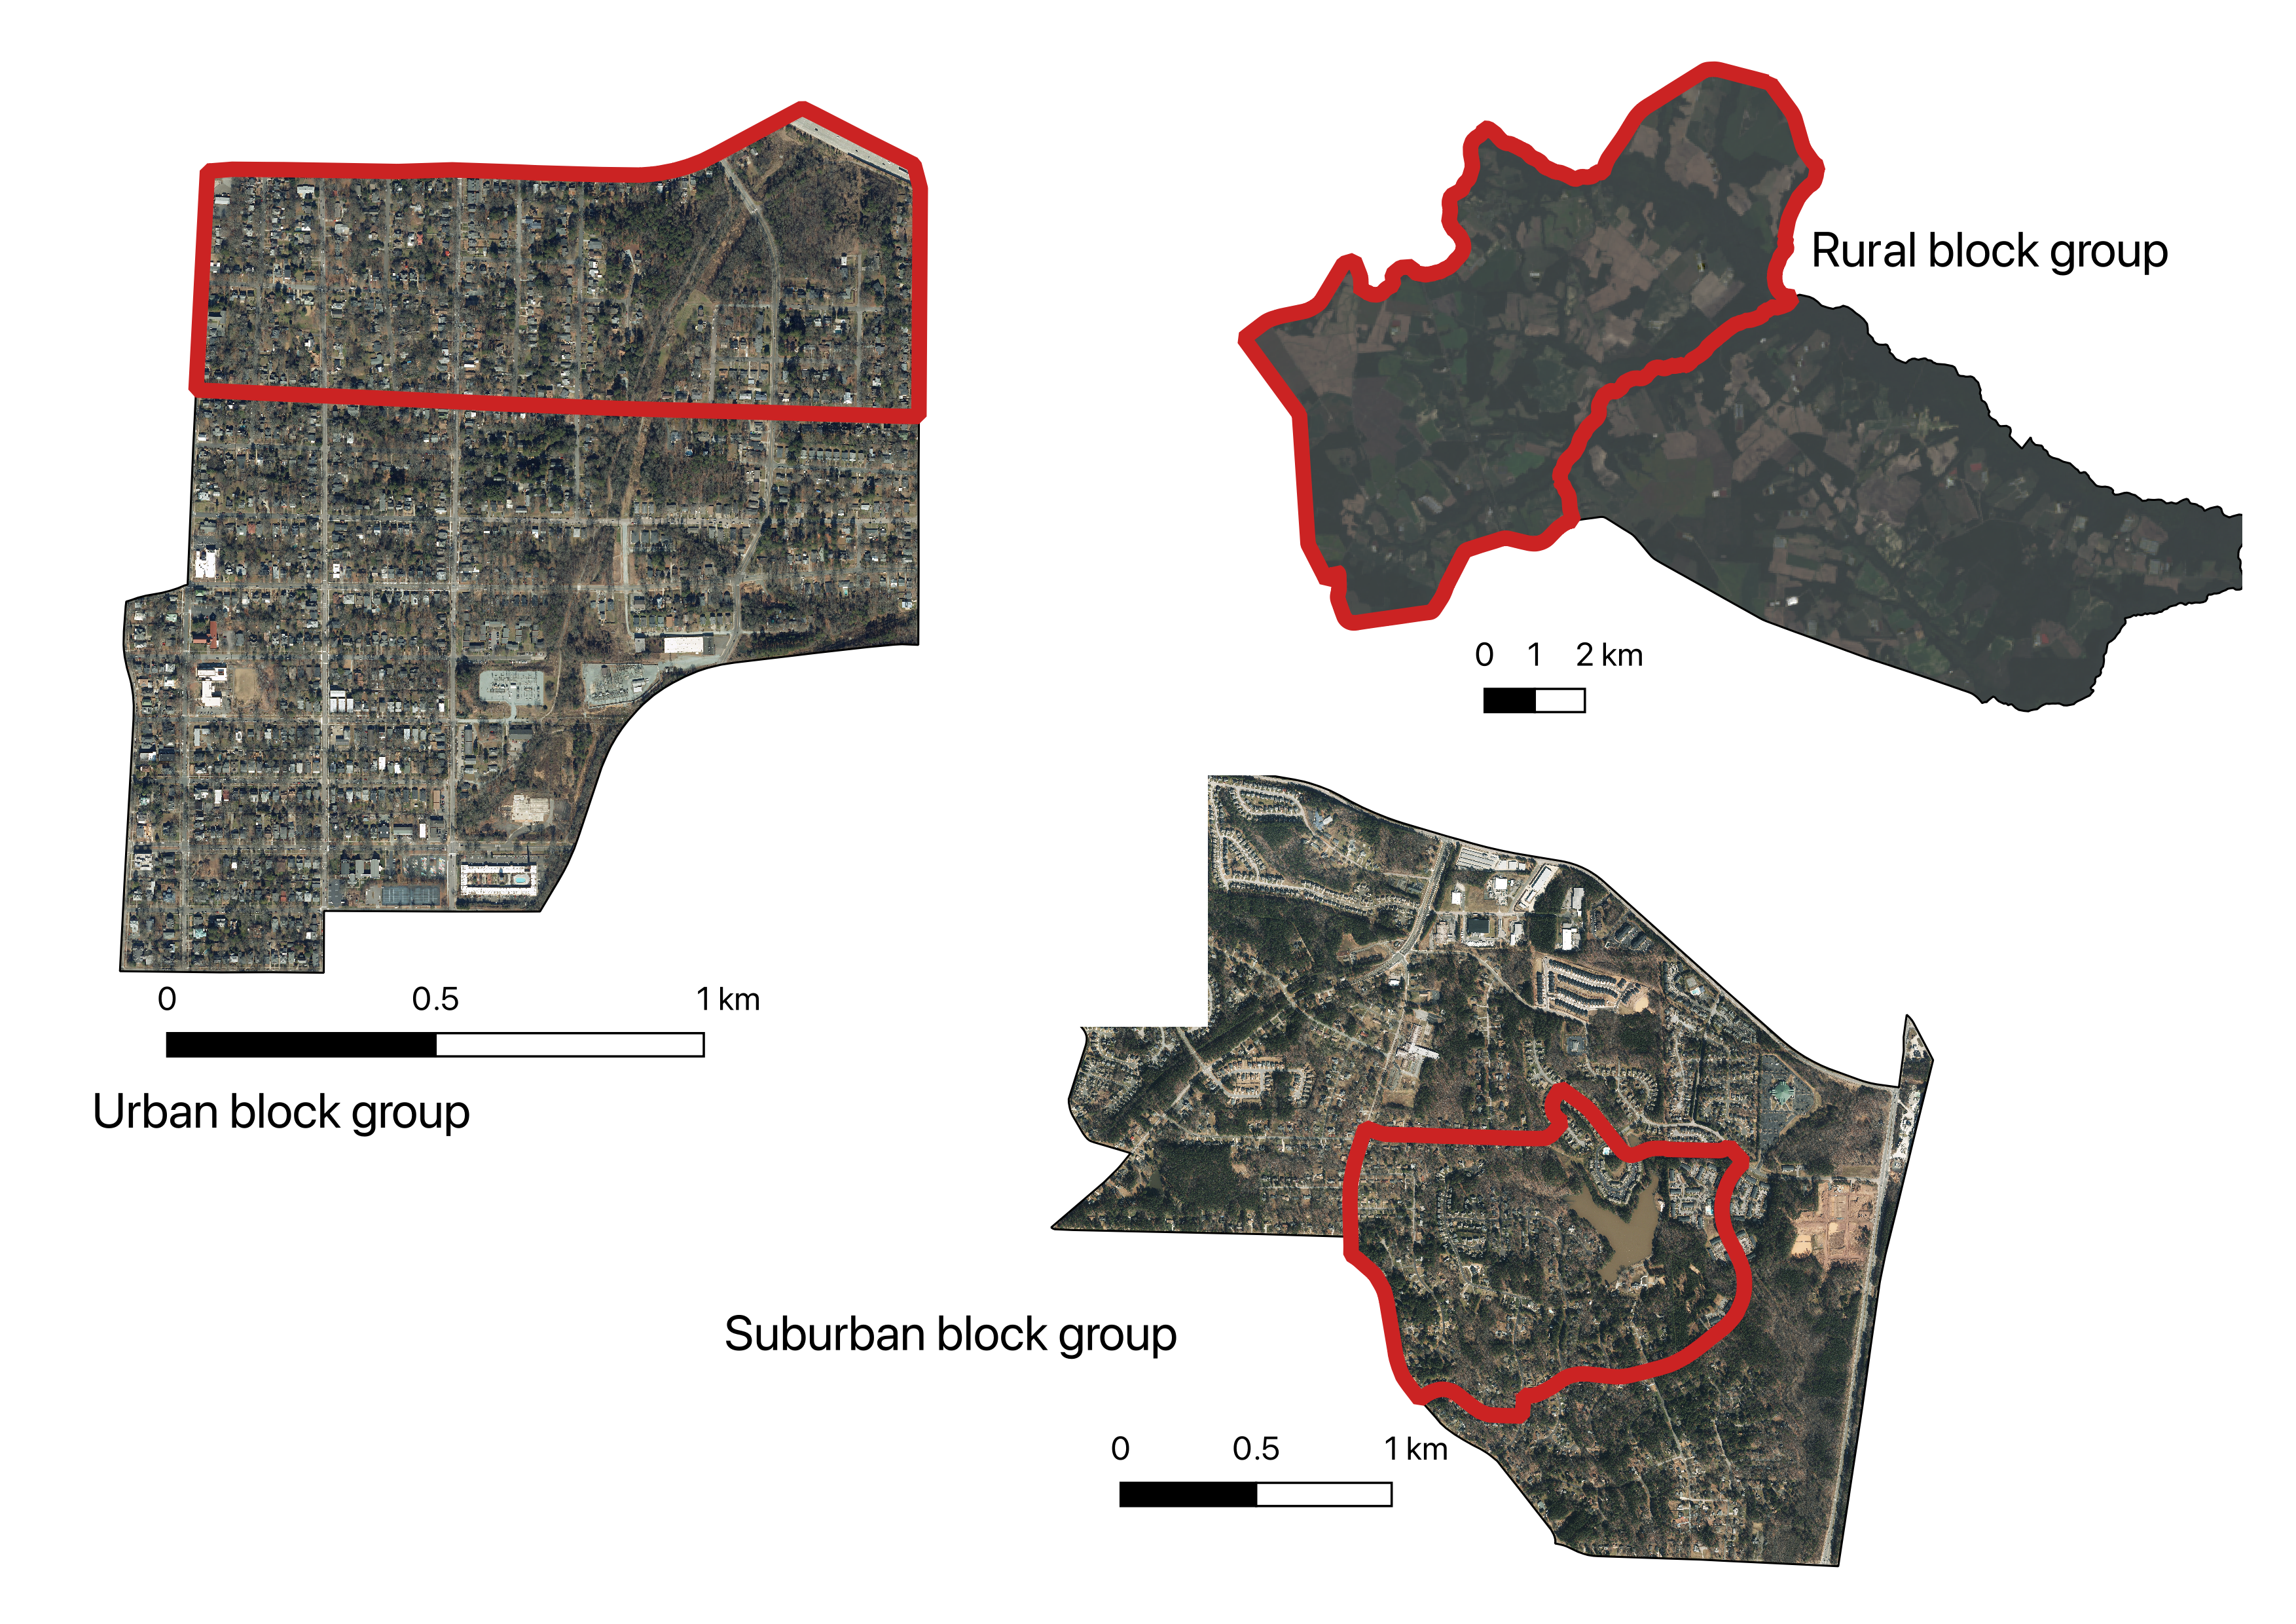
Census block groups
- Divisions of Census tracts
- Generally 600–3,000 people
- Redrawn along with tracts
Census block groups
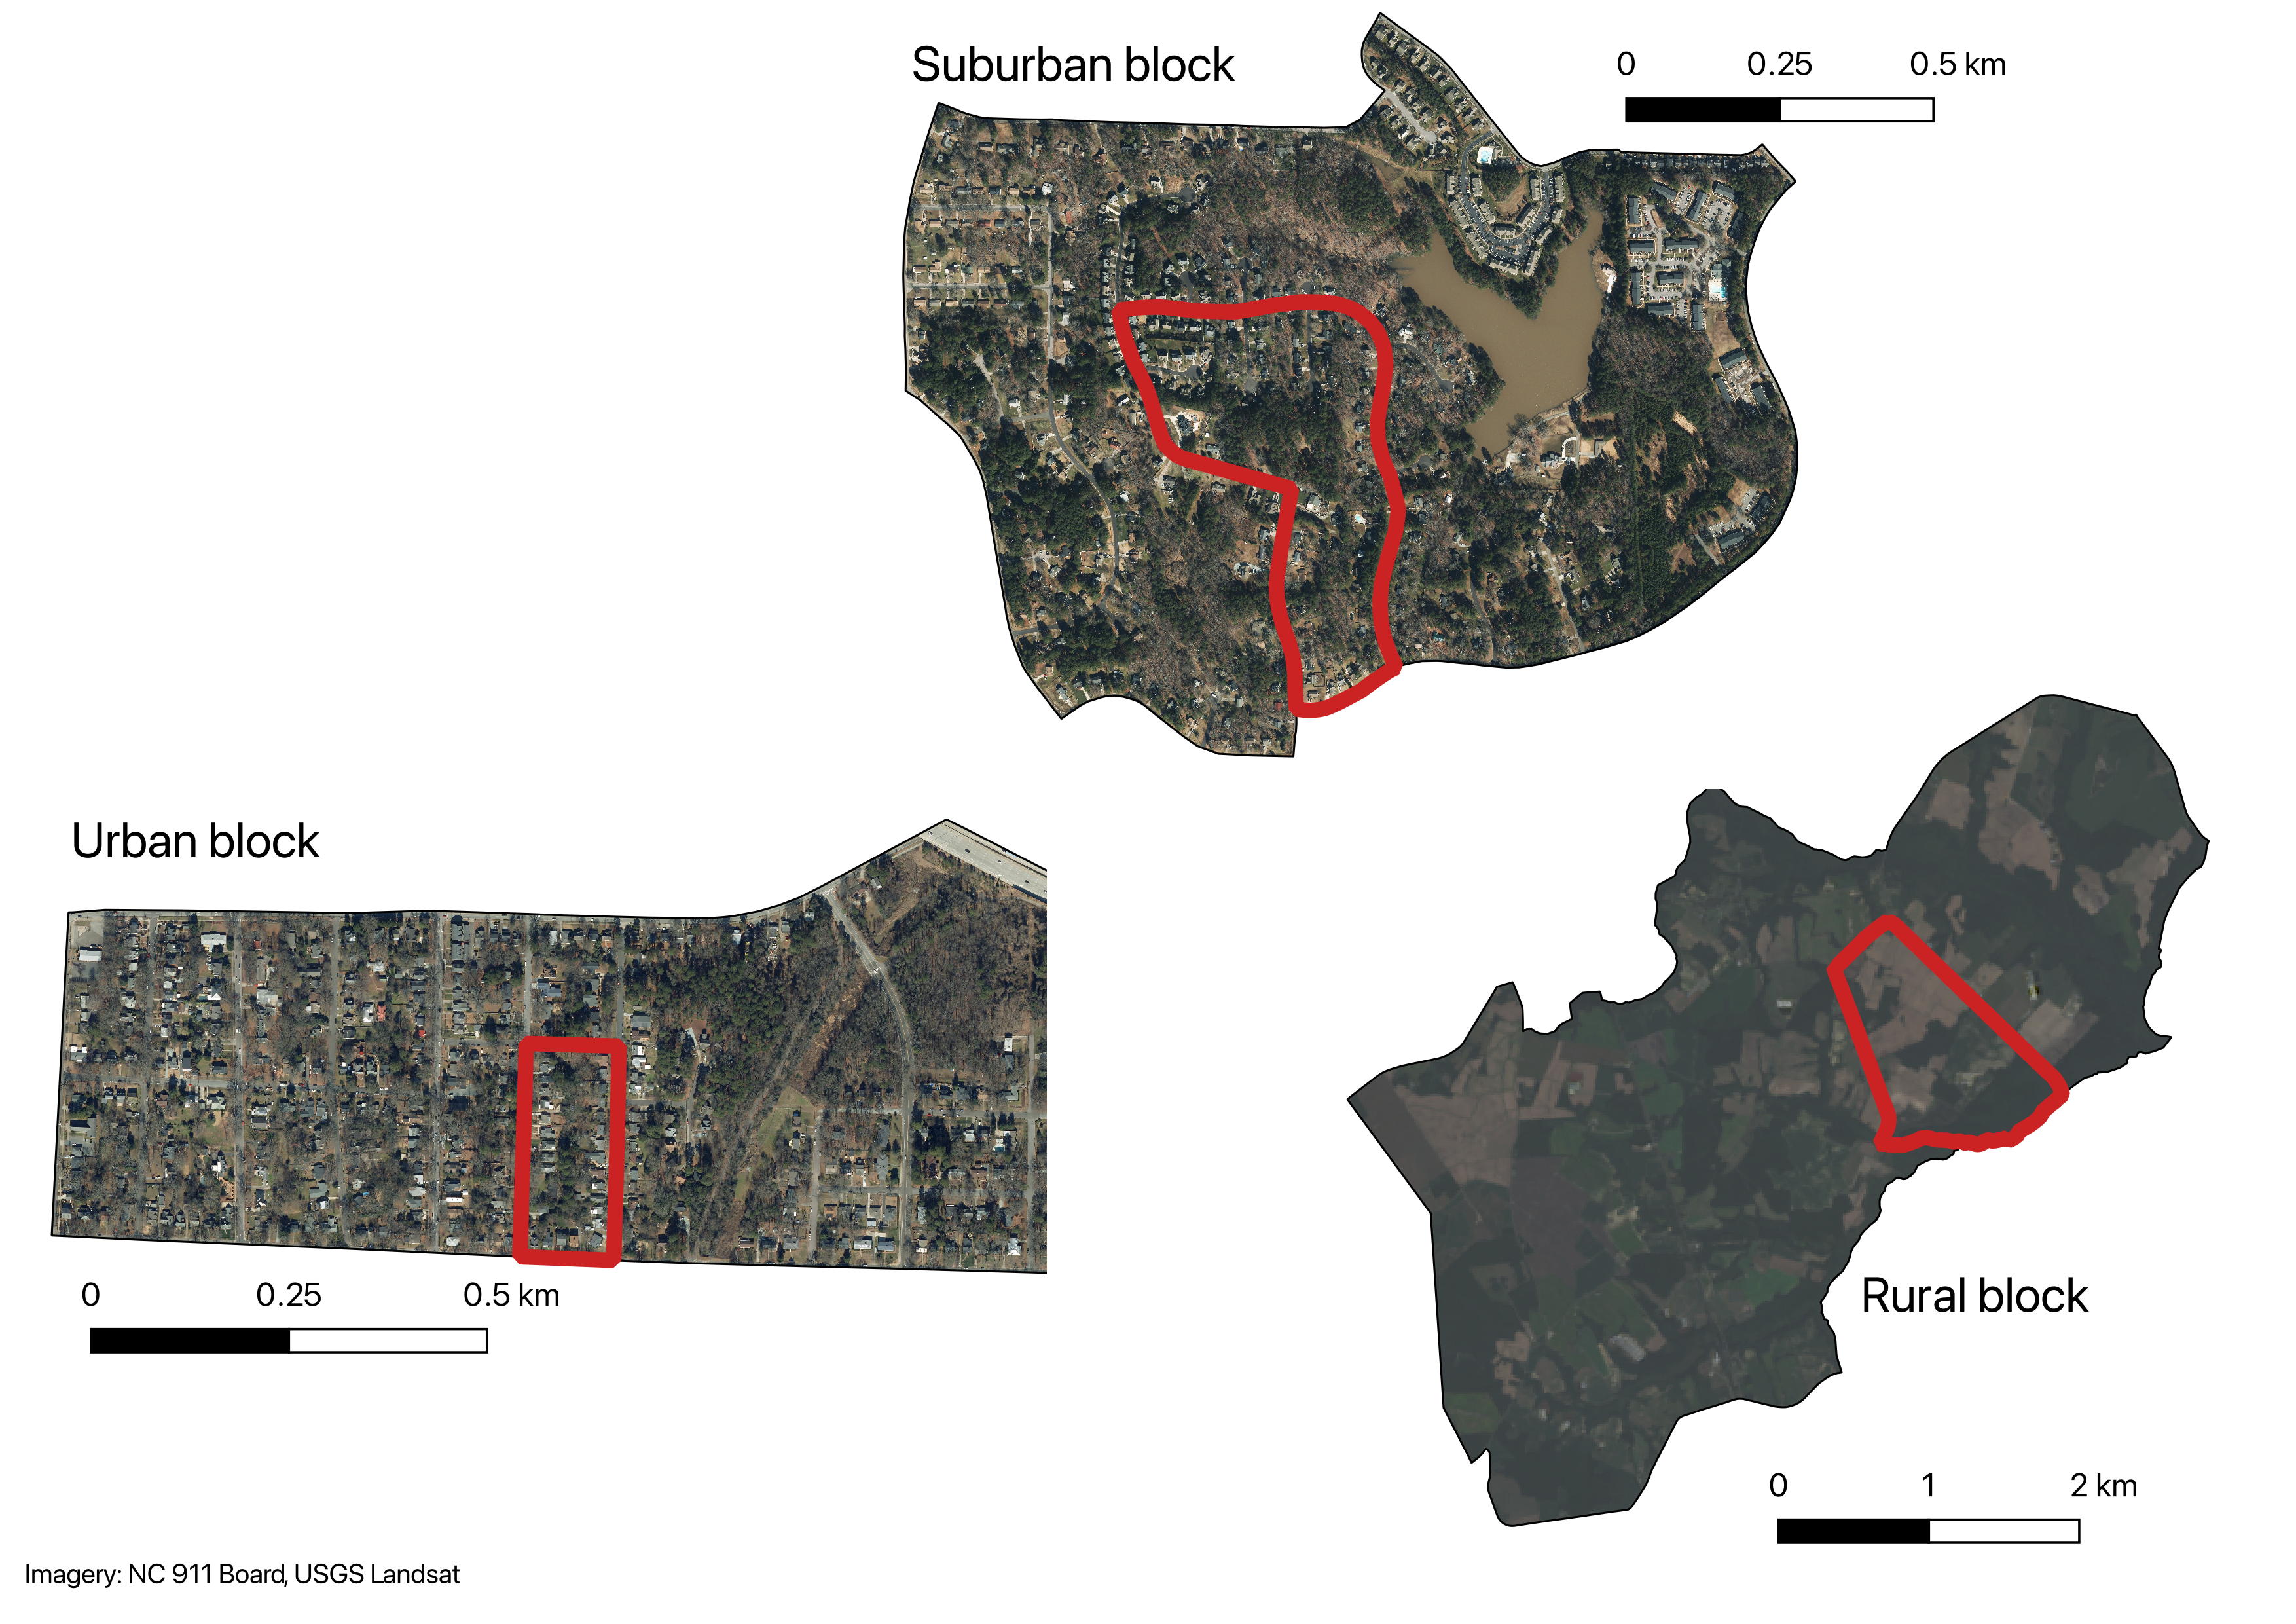
Census blocks
- Divisions of block groups
- The smallest geographic unit in the Census
- Only available in decennial census and a handful of other datasets
- Redrawn along with tracts
- In urban areas, often coincides with a single city block
Census blocks
Other Census units: Urbanized areas
- Urbanized areas are irregular shapes defined based on housing unit density and a complicated algorithm
- They may span county or state lines, and may be noncontiguous
- Not often used directly, but form the basis for metropolitan area designations
Other Census units: CBSAs
- Core-based statistical areas (CBSAs) are groupings of counties that represent cities and their suburbs
- Divided into two types: metropolitan statistical area and micropolitan statistical area
- Must have one central urbanized area
- Central counties are included based on percent urban population
- Outlying counties are included based on commuting flows
- Metropolitan statistical areas are often used in analysis
Combined statistical areas (CSAs)
- Sometimes large metropolitan areas are divided into two metropolitan areas
- Raleigh-Cary and Durham-Chapel Hill-Carrboro are separate metropolitan statistcal areas
- As are San Francisco-Oakland and San Jose, or Los Angeles, Riverside, and Ventura in California
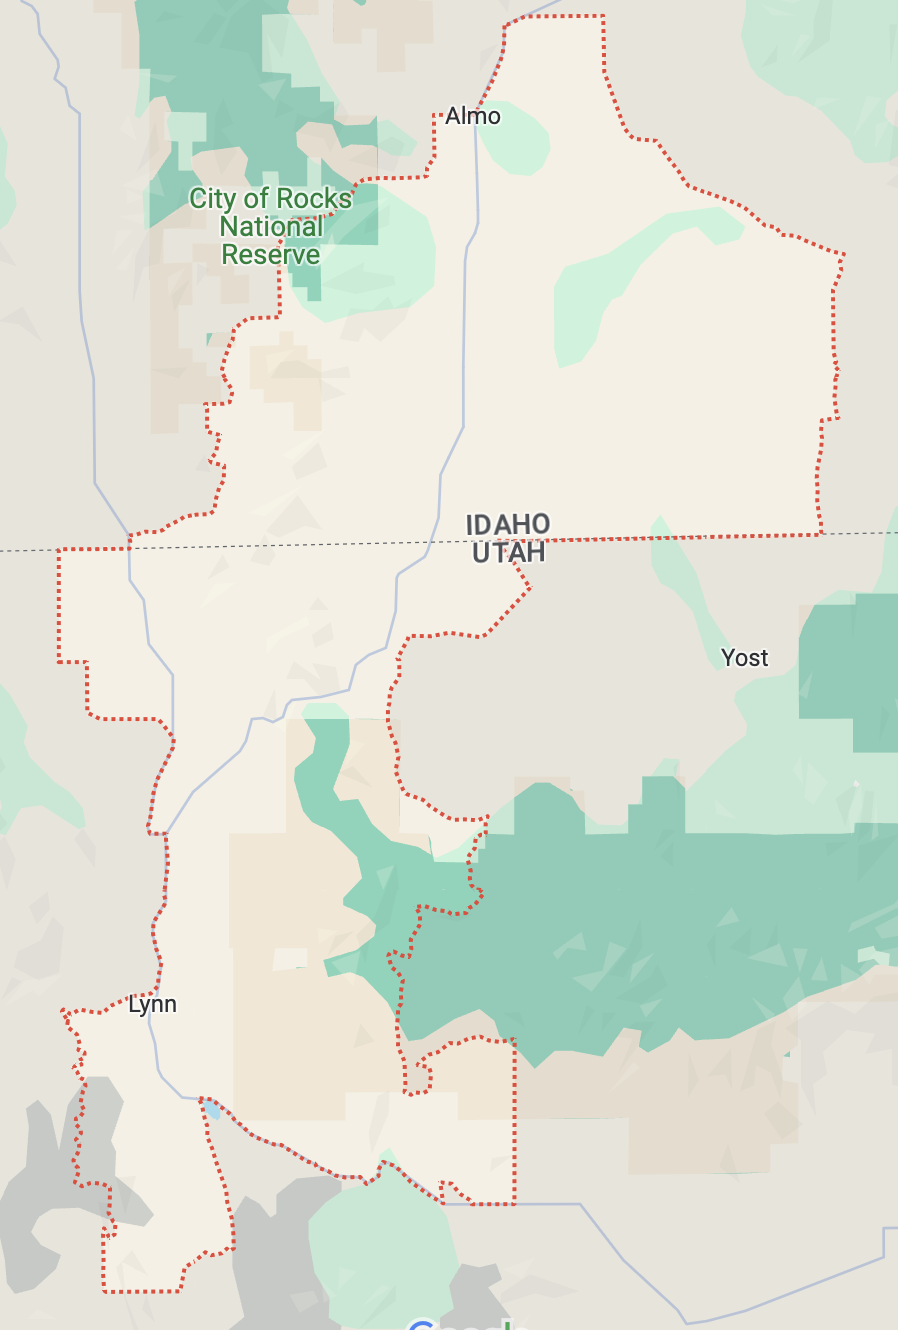
Problems with CBSAs and CSAs
- Based on counties, so they have the same problems as counties
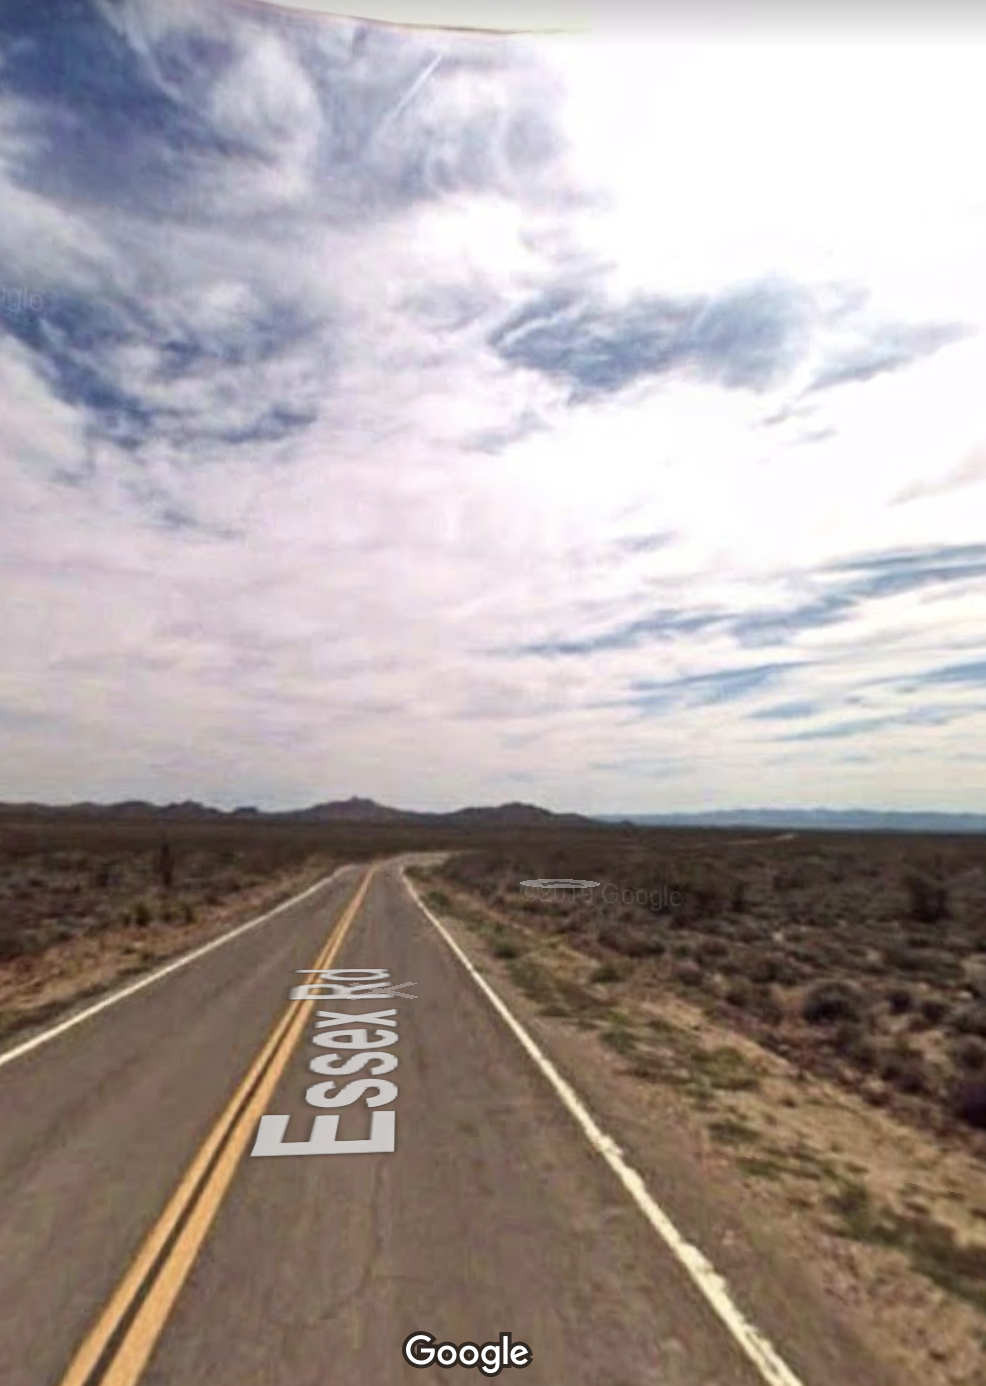
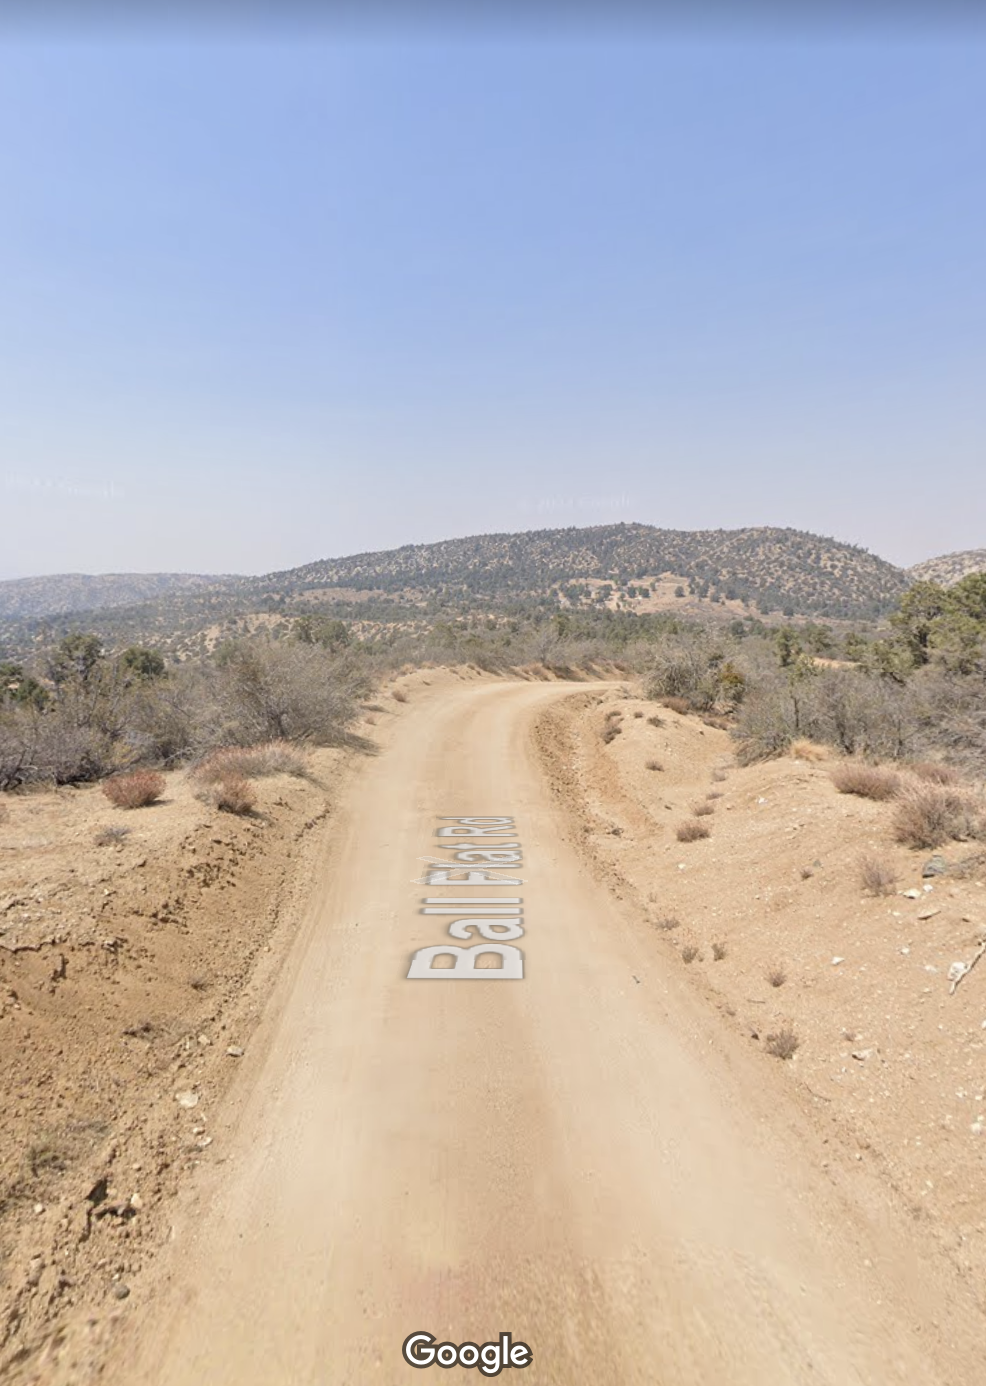
Scenes from Metropolitan Los Angeles
Other Census units: PUMAs
- Public use microdata areas (PUMAs) contain at least 100,000 people, and nest within states
- Often cross county lines
- The smallest geographic area that public microdata (individual Census responses) are available at (to protect privacy)
- The smallest geographic units with annual ACS data that cover the entire country
Other Census units: ZCTAs
- ZIP code tabulation areas (ZCTAs) are based on ZIP codes (postcodes)
- Very useful for joining Census data to other data with ZIP codes
- Mostly useless otherwise
Problems with ZIP codes
- ZIP codes are not geographic areas, they are lists of addresses optimized for mail delivery
- ZIP codes do not nest within counties or even within states in all cases
- Some ZIP codes are assigned to specific entities, for instance 20505 is CIA headquarters
Other Census Bureau surveys
- In addition to the ACS and the Decennial Census, the Census Bureau compiles many other surveys and data products
- American Housing Survey
- Longitudinal Employer-Household Dynamics/Longitudinal Origin-Destination Statistics (LEHD LODES)
- Current population survey
- Building permits survey
- Household Pulse survey
- American Time Use Survey
- many more
The structure of ACS and Decennial Census data
- ACS and Decennial Census data are presented in thousands of tables, at different geographic levels
- These tables represent cross-tabulations of different characteristics for a particular geographic area
- Very often, we want to analyze two or more variables simultaneously
- Often, the Census will have a crosstab specific to those two variables
The structure of ACS and Decennial Census data
Collecting the Decennial Census
- The Decennial Census is conducted every ten years, in years ending in zero
- Most households are invited by mail, with an option to respond online or by mail
- Some surveyed in person, some by phone
- One of the highest-quality data collection efforts in the world, but not perfect—the 2020 Census likely undercounted Hispanic, Black, and Native American residents
- Cities and states can appeal their counts if they think they were undercounted
- All of this matters: New York State was 89 people short of keeping all of their House seats

Collecting the ACS
- The ACS is conducted annually
- 3.54 million addresses sampled, with oversamples in rural areas (US Census Bureau 2022)
- Response rates generally 85-98%; some decline since the pandemic
Margins of error in the ACS
- Because the ACS is based on a sample, every estimate has a margin of error associated with it
- Sometimes these margins of error are large, especially in 1-year samples, rural areas, and small subsets of the population
- the percentage of people in Tyrrell County, NC who are Hispanic is 4.1% ± 3.0 (2021 5-year ACS)
- 0.7% ± 0.5 of Durham County households live in mobile homes (2022 1-year ACS)
- 69 ± 60 people with less than a high school degree moved to Alamance County, NC in the last year (2021 5-year ACS)
- The Census presents 90% margins of error
- You can convert the margin of error to the standard error by dividing by 1.645
- And get a 95% confidence interval by multiplying that by 1.96
One and five year ACS
- To provide better estimates, the ACS is released in one- and five-year versions
- The five-year versions aggregate the samples from five years to provide less sampling error and smaller margins of error
- One-year data is only released for areas with over 65,000 people (40% of NC counties, 26% of all counties)
- Five-year data is released all the way down to block groups (though margins of error can still be large)
Retrieving Census data
- There are several tools to retrieve Census data
- Simplest: Census Reporter (free), Social Explorer (not free)
- Most complete: data.census.gov (free)
- For power users: NHGIS,
tidycensusR package (both free) - If you need confidential microdata: Federal Statistical Research Data Centers
Using Census Reporter
- Quick and easy access to a wide variety of current statistics about communities
- Limited to most recent 1- and 5-year ACSs
- Let’s look up some information about Chapel Hill
Using Census Reporter
- Visit https://censusreporter.org
- Search for Chapel Hill, NC
Drilling deeper
- The main page has a lot of information, but the Census goes much deeper than this
- For instance, it doesn’t say anything about what people do for work
- Search for “occupation” at the top the page
- Click on “means of transportation to work by occupation”
Drilling deeper
- This is a fairly typical Census table
- Many Census tables present crosstabs of 2–3 variables
- The numbers are counts of people in each category
Table “universes”
- The top of the table has a line “Table universe”
- This is the overall set of people or housing units that this table is based on
- For instance, this table is showing percentages of workers 16 and over
- The universe is important; making comparisons between tables with different universes will mislead
Making comparisons
- In the left column, there is an option to “add a geography”
- Enter Durham, NC
- Notice that you now have a column for Durham as well as Chapel Hill
- Using the means and margins of error, you can make rough comparisons
- This test is conservative; even if the margins of error overlap they may be statistically significantly different
- We’ll talk about how to do hypothesis tests with these data later
- Is the proportion of workers in management, business, science, and arts statistically significantly different between Durham and Chapel Hill
Explore
- With a partner, think about a research/policy question you’re interested in
- Discuss what data might be useful, and see if you can find it on Census Reporter
- This doesn’t have to be your question or your group for the project - but it could be!
Hypothesis testing with Census data
- Just comparing confidence intervals is conservative - because even if they overlap slightly, the probability that both population means are in the overlap may still be small
- You can also do a two-sample hypothesis test
- The standard error of the difference between two ACS point estimates is \[ \mathrm{SE}(\hat x_1 - \hat x_2) = \sqrt{\mathrm{SE}(\hat x_1)^2 + \mathrm{SE}(\hat x_2)^2} \] where \(\hat x_1\) and \(\hat x_2\) are the estimates that you are comparing, and \(\mathrm{SE}(\hat x_1)^2\) and \(\mathrm{SE}(\hat x_2)^2\) are the standard errors of each of the estimates
Hypothesis testing with Census data
- You can then calculate a \(z\)-score by dividing the difference by its standard error: \(\left\lvert\frac{\hat x_1 - \hat x_2}{\mathrm{SE(\hat x_1 - \hat x_2)}}\right\rvert\)
What the heck is a \(z\)-score?
- A \(z\)-score is like a \(t\)-score, but used with the standard normal distribution (mean 0, standard deviation 1)
- Since it’s normally distributed, you can then just compare with standard critical values
- If greater than 1.645, it is statistically significant at \(\alpha = 0.1\)
- If greater than 1.96, it is statistically significant at \(\alpha = 0.05\)
- If greater than 2.576, it is statistically significant at \(\alpha = 0.01\)
- Is this a one- or two-tailed test? 🤯
Calculating a \(p\)-value
- Or you can calculate a \(p\)-value in Excel:
=NORM.DIST(-z, 0, 1, TRUE) * 2 - Why are we using
-z?
Why don’t we use a \(t\)-score?
- Because the Census Bureau told us to use a \(z\)-score
- Their samples are pretty large, so the normal and \(t\) distributions will be quite similar
- They also use a complicated stratified and weighted sample, so standard error calculation is more involved
Calculating a hypothesis test from Census data
- Let’s see if the proportion of people in management, business, science, and arts occupations are different in Chapel Hill vs. Carrboro
- Add Carrboro, NC to your comparison table on Census Reporter
- Proportion in Chapel Hill: 64.1% ± 2.1
- Proportion in Carrboro: 67.1% ± 3.2
- Calculate standard errors from the margins of error
- Chapel Hill: \(2.1 \div 1.645 = 1.277\)
- Carrboro: \(3.2 \div 1.645 = 1.945\)
- Calculate the combined standard error: \(\sqrt{1.277^2 + 1.945^2} = 2.327\)
- Calculate the difference in point estimates: \(64.1 - 67.1 = -3\)
- Calculate the \(z\)-score: \(\left\lvert\frac{-3}{2.327}\right\rvert = 1.289\)
- Calculate the \(p\)-value:
=NORM.DIST(-1.289, 0, 1, TRUE) * 2= 0.2
Calculating a hypothesis test from Census data
- What are the null and alternative hypotheses?
- At the \(\alpha = 0.05\) level, do we reject the null hypothesis?
- What does this mean?
The ecological fallacy
- Assuming the attributes of a group apply to all members of that group
- For instance, finding that people from low-income Census tracts use ridehailing heavily may not mean that low-income people do
- Very easy to do with Census data and spatial units, even accidentally
- Common when using Census data in regression
- Ideally, you have a Census crosstab for the variables you’re interested in
The ecological fallacy
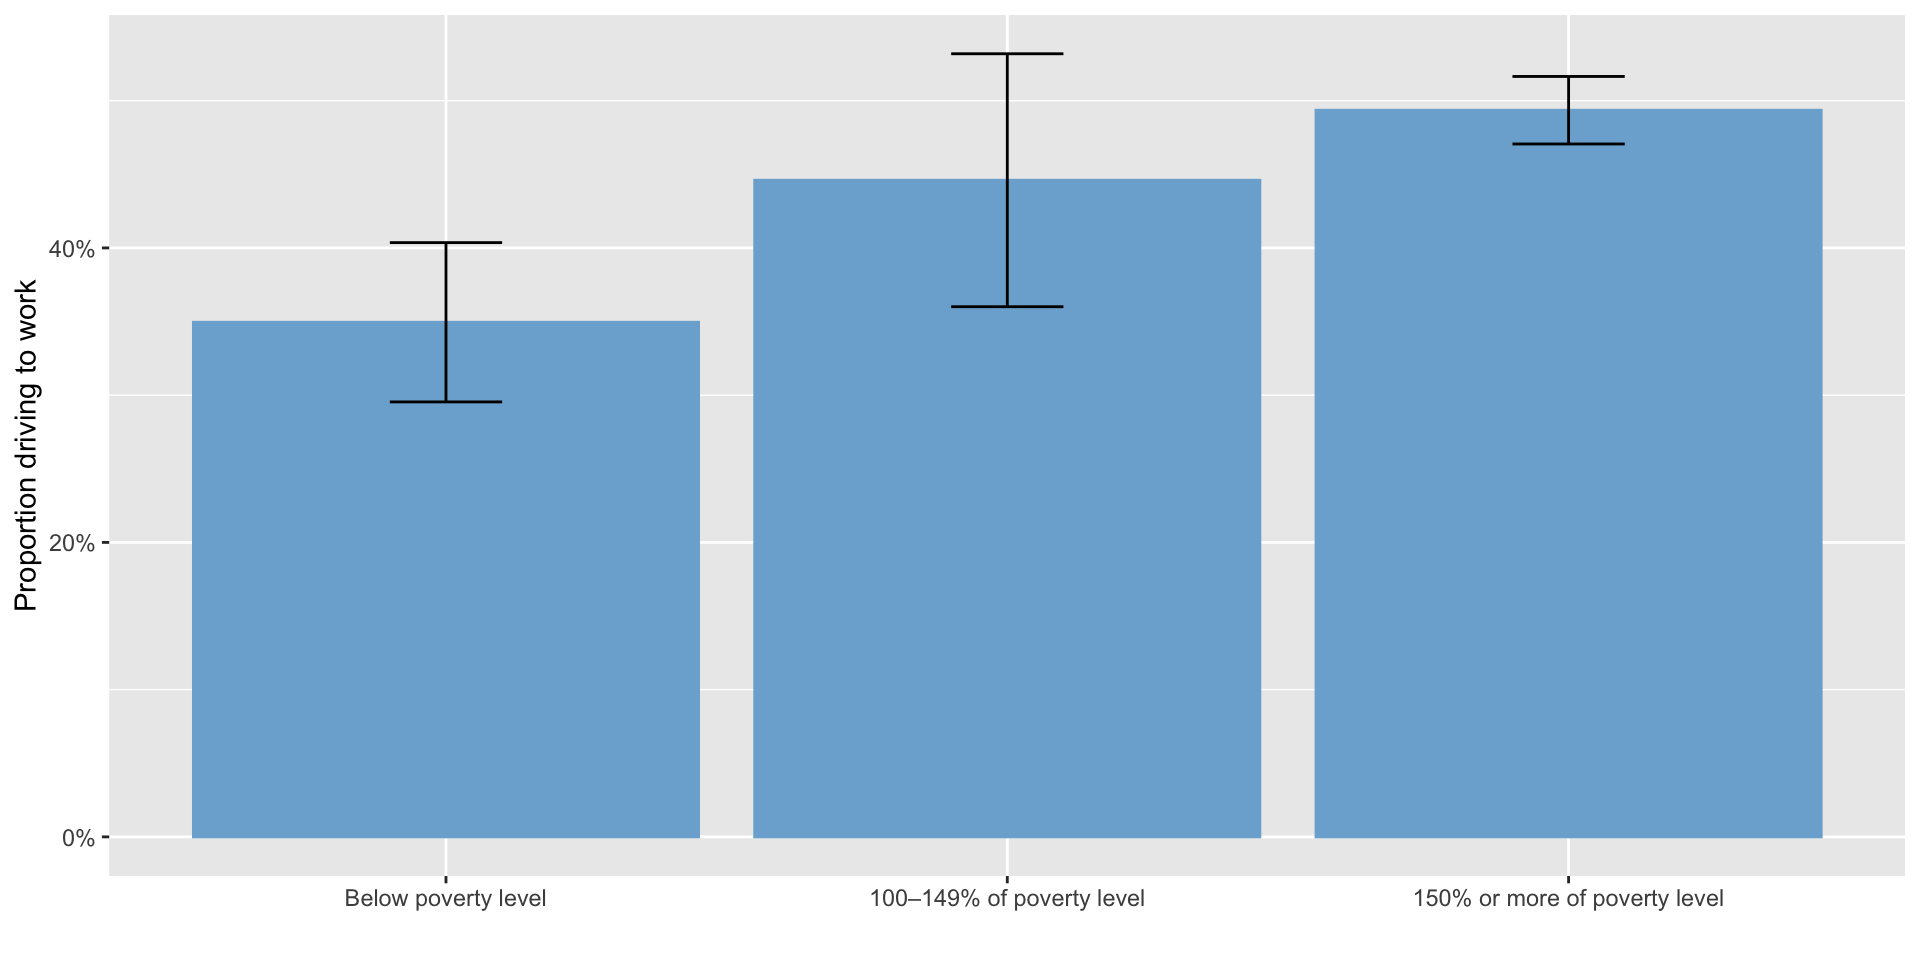
- In Boston, MA, 6.9% ± 0.4 or workers are below the poverty line (2021 5-year ACS)
- 41.5% ± 0.7 of workers drive to work
- In the Mattapan-Roxbury PUMA, 11.1% ± 1.3 are below the poverty line
- 46.8% ± 2.0 of workers drive to work
- Does this mean low income people are more likely to drive to work?
The ecological fallacy
The Modifiable Areal Unit Problem (MAUP)
- Depending on the units used, the answer may change
- Relationships presented at the tract level may not be true at the county level, for example
Gerrymandering and the modifiable areal unit problem
- Gerrymandering is an extreme example of the MAUP
- Intentionally choosing areal units to give the answer you want
Geographic IDs
- The Census bureau has a system of geographic identifiers for each spatial unit they use
- For instance
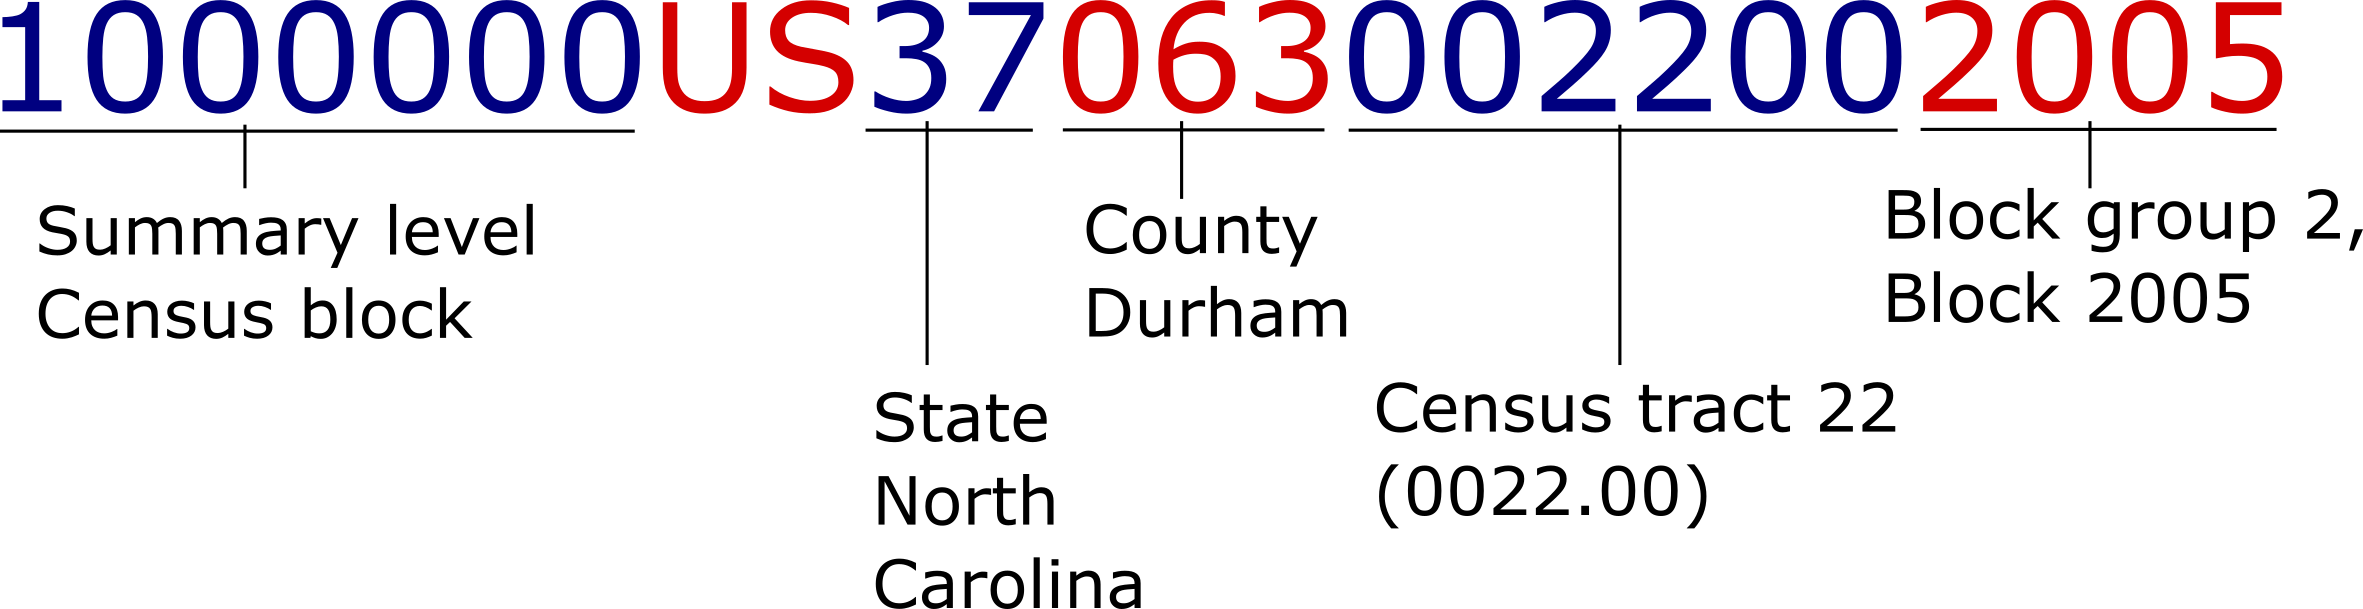
0500000US37063is Durham County, and1000000US370630022002005is the Census block where Geer St. Garden is
Geographic IDs
- IDs are hierarchical, also known as FIPS codes
![Demonstration of GEOID components for 1000000US370630022002005: 1000000: Summary level Census block; US: United States; 37: State North Carolina; 063: Durham County; 002200: Census tract 22; 2005: Block group 2, block 2005]()
- You may also see IDs without the
1000000US- Make sure in these cases that Excel treats them as text and not numbers
- Do not drop leading zeros (e.g. California is code 06)
Using data.census.gov
- If you need more detailed information than you can get from Census Reporter, data.census.gov is a good option
- Currently down, womp womp
- Much more powerful and with more data than Census Reporter, but harder to use
- NHGIS is an alternative
Using data.census.gov
- Open data.census.gov
- The main page has a search box, which occasionally brings up what you are looking for
- Broadband internet connections are essential to participating in the modern economy, but different people/places have different levels of access
- Let’s search for “broadband internet in Chatham County, NC”
Using data.census.gov
- You likely got a general page about Chatham County, not anything about internet
- Try just searching for “broadband”
- This will list Census tables relevant to broadband access
- Select Table S2801 - this looks like it has the information we need
- Tables starting with S are “subject tables” which provide general information on a particular topic
- It’s often easier to find the table you’re looking for first, and then specify the location
Using data.census.gov
- Click “filters”, and under “geography” choose “county”
- Select “North Carolina” and then “All counties in North Carolina”
- Scroll the table view to the right to see the data for different counties
- You may have to select a cell and use the arrow keys
Export the data
- Click the “Excel” button in the top right to export the data
- This basically brings the exact table you’re looking at into Excel
Download the data
- Clicking the “Excel” button brings exactly the table you’re looking at into Excel, formatted the same way
- If you just want to include a table in a report or something, this is often what you want
- But if you want to do further analysis, this format isn’t very useful - counties are in columns instead of rows, and margins of error, counts, and percentages are mixed within the same row
Download the data
- Instead of exporting the table, you can download it
- This basically gives you the original Census table without additional formatting
Download the data
- If you don’t see the list of tables in the left column, click on “Results” in the far left to bring it back
- Click “Download Table Data”
- Select the tables you want to download (just S2801 in this case)
- Click “Download”
- Wait for the ZIP file to download
Download the data
- The ZIP file contains several files
- The one you’ll probably be interested in is the
-Datafile - Open this up
Download the data
- Each row is a county (or tract, or whatever you selected in the data.census.gov interface)
- Each column is either a count, a percentage, or a margin of error
- Most tables have counts of people or households in a category, but a few have other values - e.g. median income
- The counts are hierarchical - e.g. here we have total households, total household with any internet service, total household with broadband service, etc.
Download the data
- How many counties are there in North Carolina
- 100
- How many counties are in our data?
- 44
- Any ideas what happened?
- Hint: this is one-year ACS data
- Since this is one-year ACS data, we only have results for counties with 65,000 or more people
Switch to 5-year ACS
- Go back to the data.census.gov screen
- Switch Dataset to the 2021 5-year ACS
- Download again, ensure that 2021 5-year ACS is selected in the download dialog box
- You should now have all 100 counties
Using NHGS
- We’re going to get information on broadband penetration by county in NC
- Go to NHGIS.org, create an account
- Click “Select Data”
- Click “Geographic Levels” and select “County (by state)”
Using NHGIS: years
- Click “Years” and select 2023 under “non-decennial years”
- Click “Datasets” and select “2023_ACS1”
- This is the 2023 1-year ACS
Using NHGIS: topics
- Click “Topics”
- Under “Housing”, select “Computers and Internet”
- In the main window, now select “Presence and Types of Internet Subscriptions in Households”
Using NHGIS: download
- In the upper-right, click “Continue”
- You may need to choose “Select Geographic Levels” again and re-select “County”
- Click “Select geographic extents” and de-select “Select all,” then select “North Carolina”
- Click Submit, then Continue, then Submit
- It may take a few minutes to prepare, you’ll get an email
- To save time, you can also download from https://projects.indicatrix.org/plan720
- Go back to My Data on nhgis.org to download
Unzip the data and open the CSV file
- There is one row per county
- How many counties are there in North Carolina
- 100
- How many counties are in our data?
- 44
- Any ideas what happened?
- Hint: this is one-year ACS data
- Since this is one-year ACS data, we only have results for counties with 65,000 or more people
Switch to the five-year ACS
- Go back to the “My Data” page
- Click “Revise”
- Change year to 2019-2023, and dataset to 2019_2023_ACS5a
- Go through the same process to download again
Calculate the percentage without internet
- Open the “codebook” file
- No internet access is
ASJYE013 - Total is
ASJYE001- Every table will have a total field, I recommend using it
Using Census data in Excel
- Let’s create an Excel “table” so we can sort data
- We’re only interested in how many households in each county, so let’s hide all columns except the county name and the percentage
Using Census data in Excel
- Now, under Home, choose “Format as table” and pick a style you like
- This now prompts you for the range of cells in your spreadsheet where the data area
- Census data tables have two header rows, which Excel doesn’t support
- So manually edit the range to start at row 2 and skip the first header row
Using Census data in Excel
- What counties have the lowest total number of households with broadband?
- What counties have the lowest percentage?
Margins of error for derived estimates
- The margin of error of a proportion in the ACS is
\[ MOE(\hat p) = \frac{1}{\hat y} \sqrt{MOE(\hat x)^2 - \hat p^2 \cdot MOE(\hat y)^2} \]
- where \(\hat p\) is the proportion, \(\hat x\) is the numerator, and \(\hat y\) is the denominator
- If the part under the square root is negative, use the formula for a ratio (switch - to +)
Mapping Census data
- You can make rudimentary maps on data.census.gov, by clicking the map tab
- Do this, and select that you want to map the percent of people with “Broadband of any type” by clicking the map title in the top left
Getting Census GIS information
- If you want to make more complex or publication-quality maps, you’ll want to use GIS
- You can download GIS files for Census geometries from TIGER/Line
- These files only contain the spatial information
- But can be joined with Census demographic information in GIS
Using other Census surveys
- Many Census surveys are not available through data.census.gov
- The distribution format will depend on the survey, but most often they are simple CSV or XLSX files that can be used in Excel or R
- Complete list here
- Many have both aggregate tabulations and public use microdata (individual responses) available
- If you just want some statistics, aggregate tabulations will be best
- If you want to run regressions or make your own tables, public use microdata is what you want
References

This work by Matthew Bhagat-Conway is licensed under a Creative Commons Attribution 4.0 International License.
US Census Bureau. 2020. Understanding and Using American Community Survey Data: What All Data Users Need to Know. US Department of Commerce. https://www.census.gov/content/dam/Census/library/publications/2020/acs/acs_general_handbook_2020.pdf.
US Census Bureau. 2022. American Community Survey and Puerto Rico Community Survey Design and Methodology. https://www2.census.gov/programs-surveys/acs/methodology/design_and_methodology/2022/acs_design_methodology_report_2022.pdf.
![]()